Community Edition: Getting started
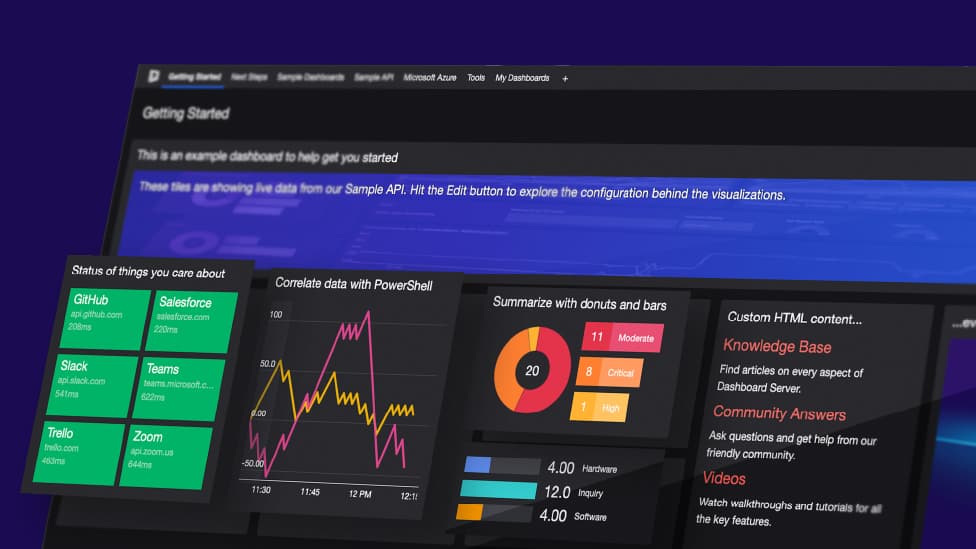
SquaredUp Community Edition lets you and your team create beautiful dashboards, for any tool or data, that you can share with everyone in your organization.
Here’s a quick introduction to the product where we show you exactly what you can achieve, in no time at all.
Let’s start with the three tabs on the top left of the screen: Getting Started, Next Steps, and Sample Dashboards. We’ll run through them one by one.
Getting Started dashboard
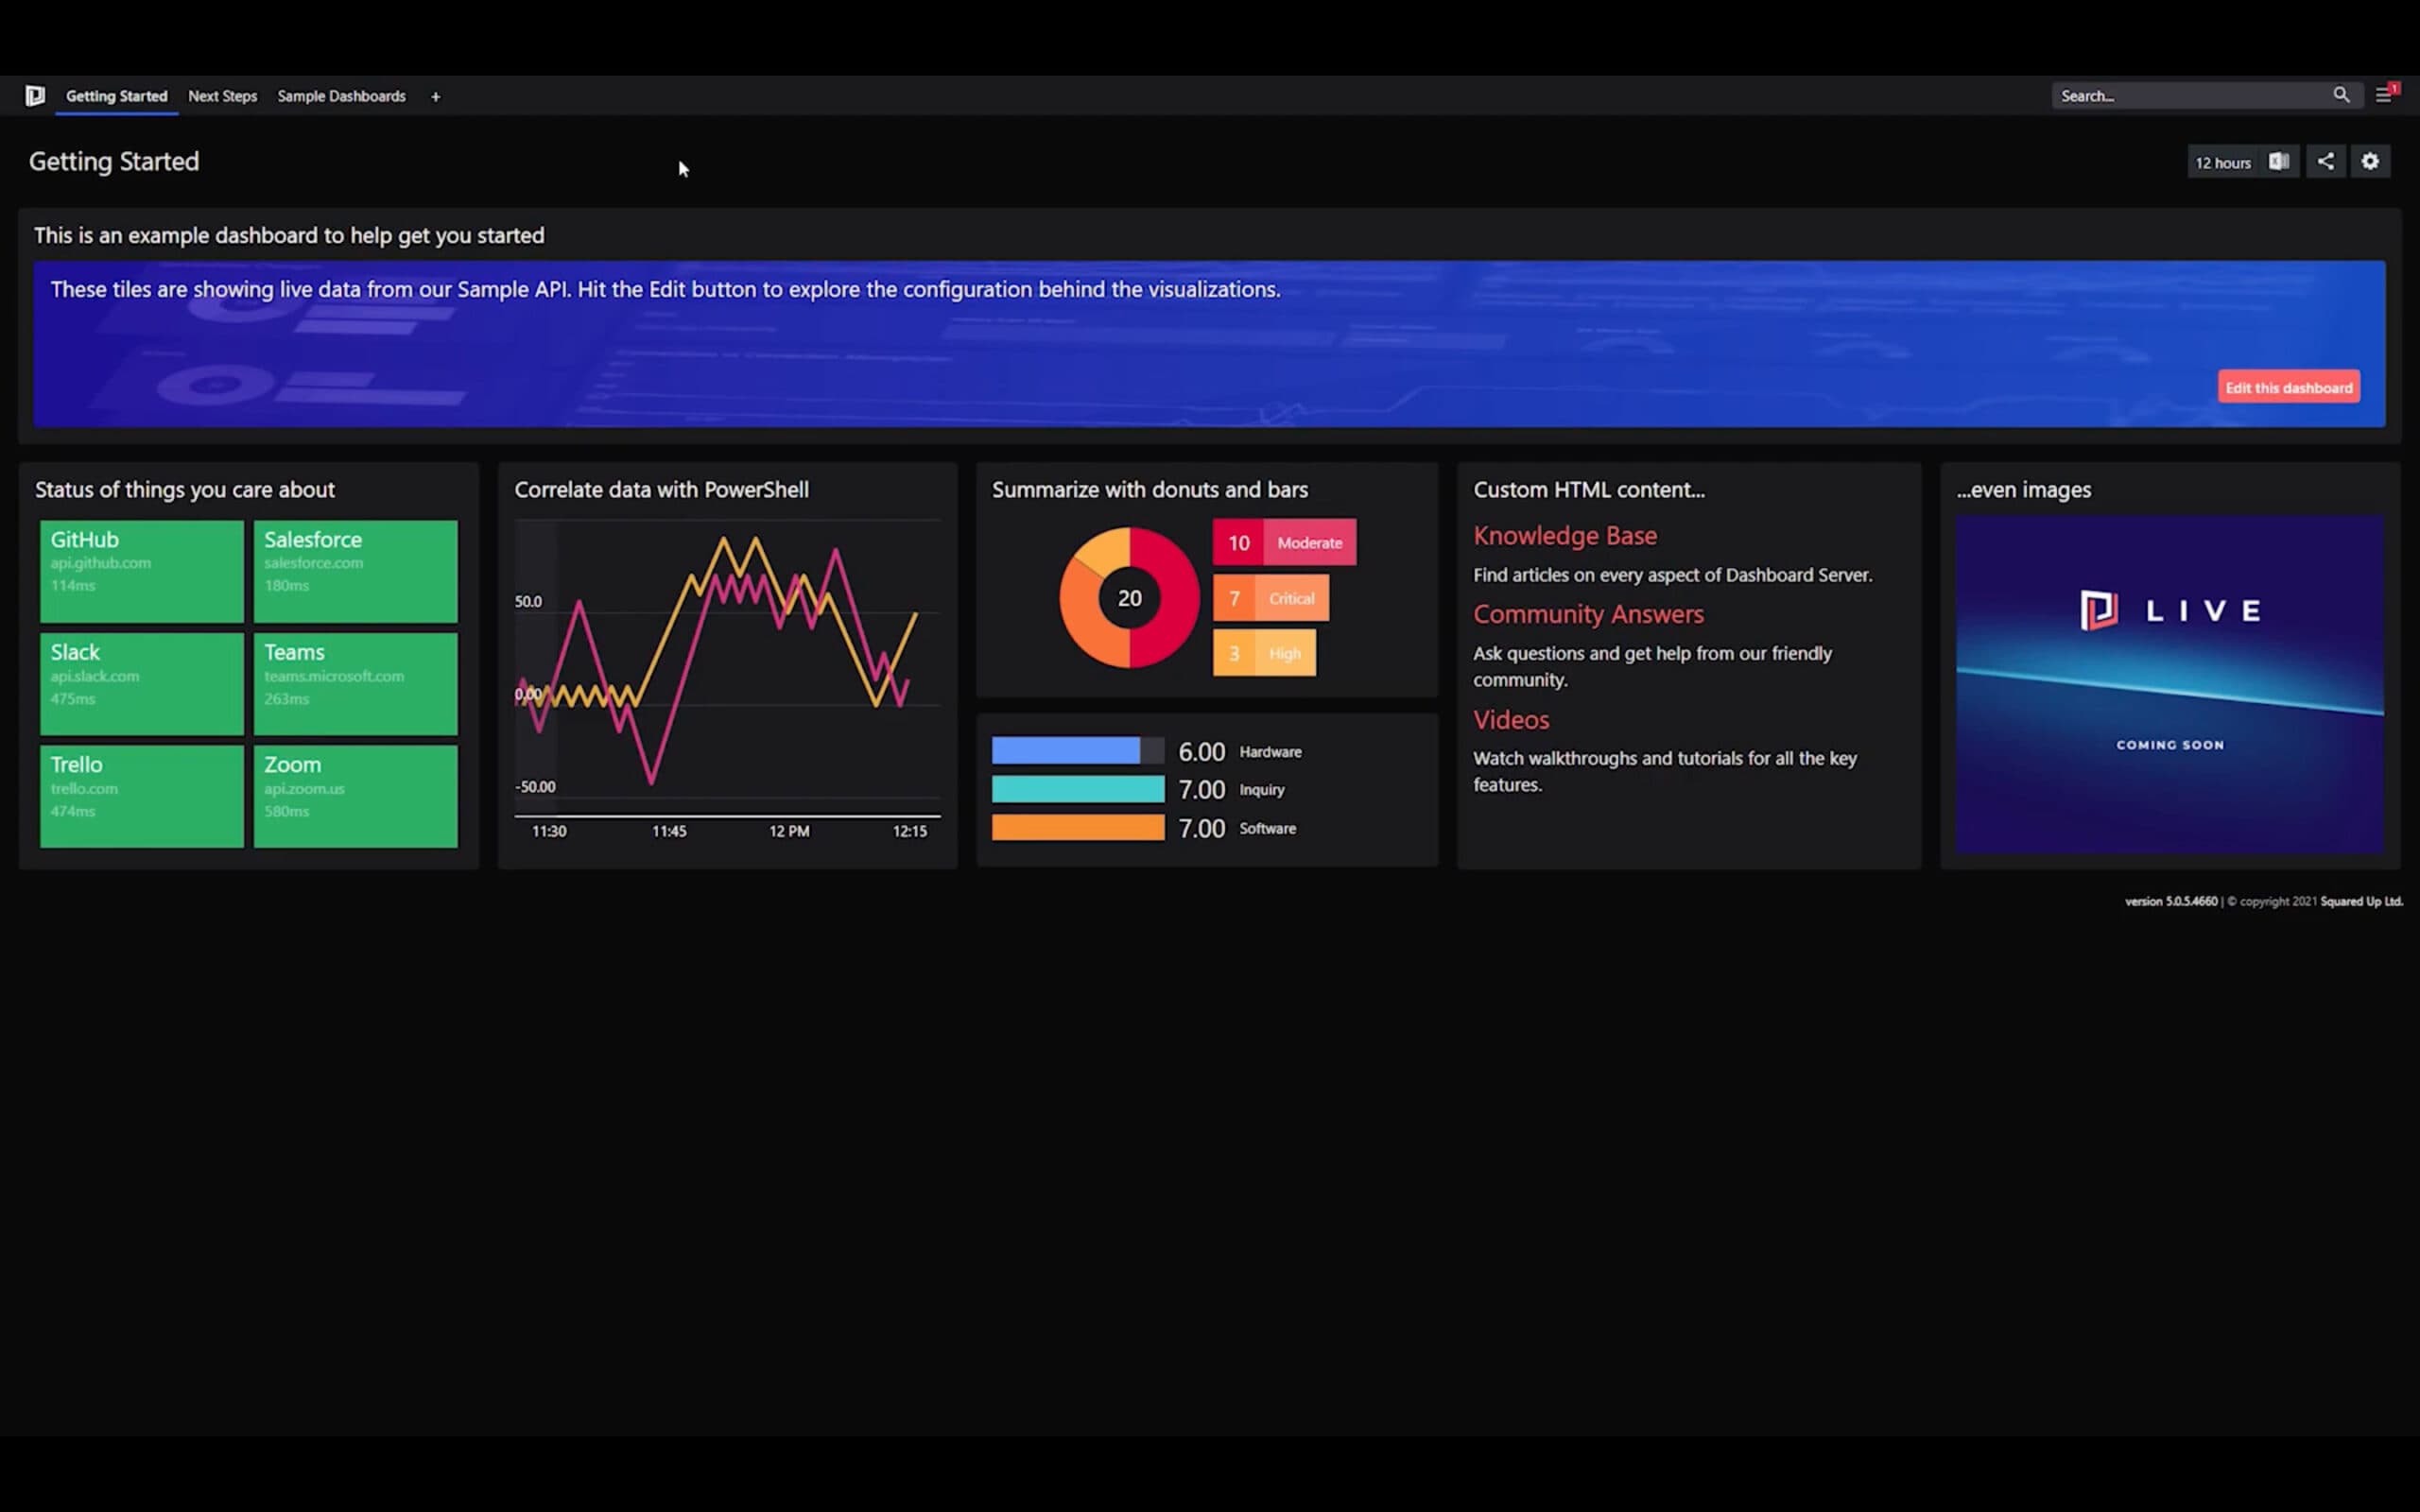
First, let's explore the Getting Started dashboard we put together for you. By clicking on the cog in the top right of the dashboard, you can take a look at how each of the tiles are configured.
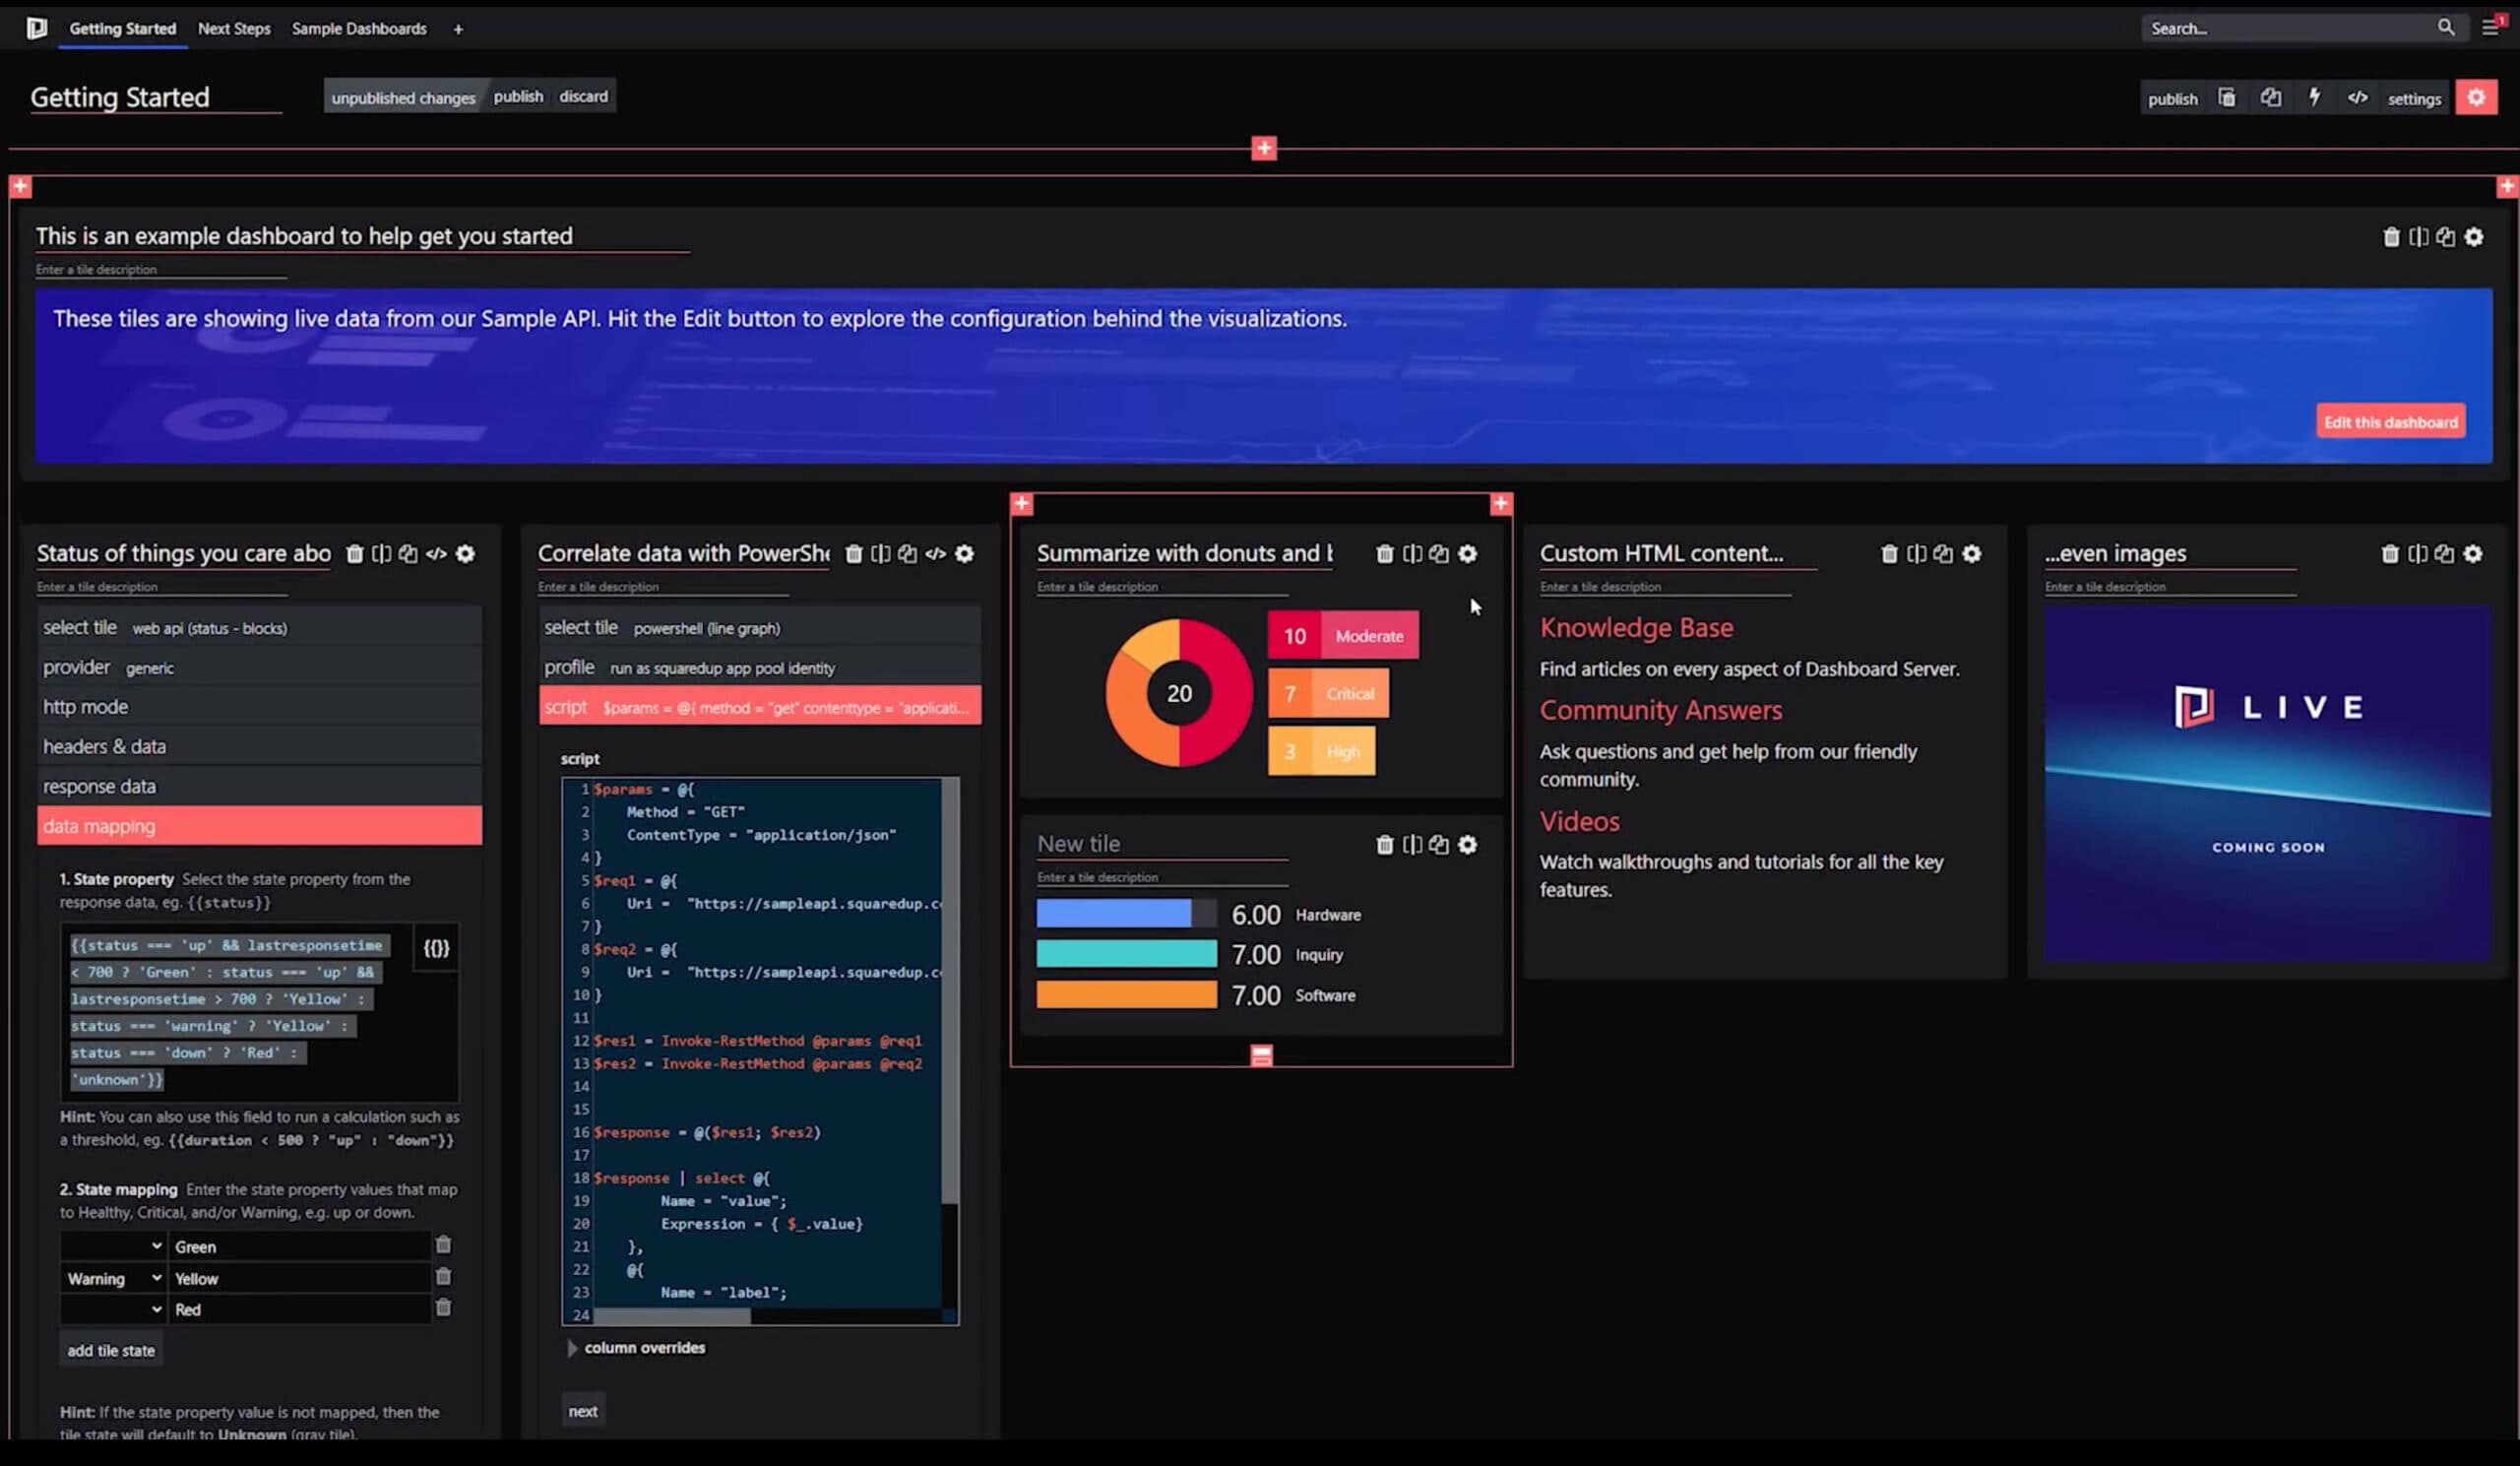
Then you can click on the cog in the top right of each tile to explore. Check out the status tile displaying insights at a glance for our most important metrics. And the PowerShell tile being used to extract, combine, and visualize data from anywhere. As well as the other visualizations and integrations.
Sample dashboards
Next, let’s take a look at some sample dashboards we’ve created, populated with real-time data from our public API. The samples include dashboards for the business team, service desk, app team, and security team.
Sales and business dashboard
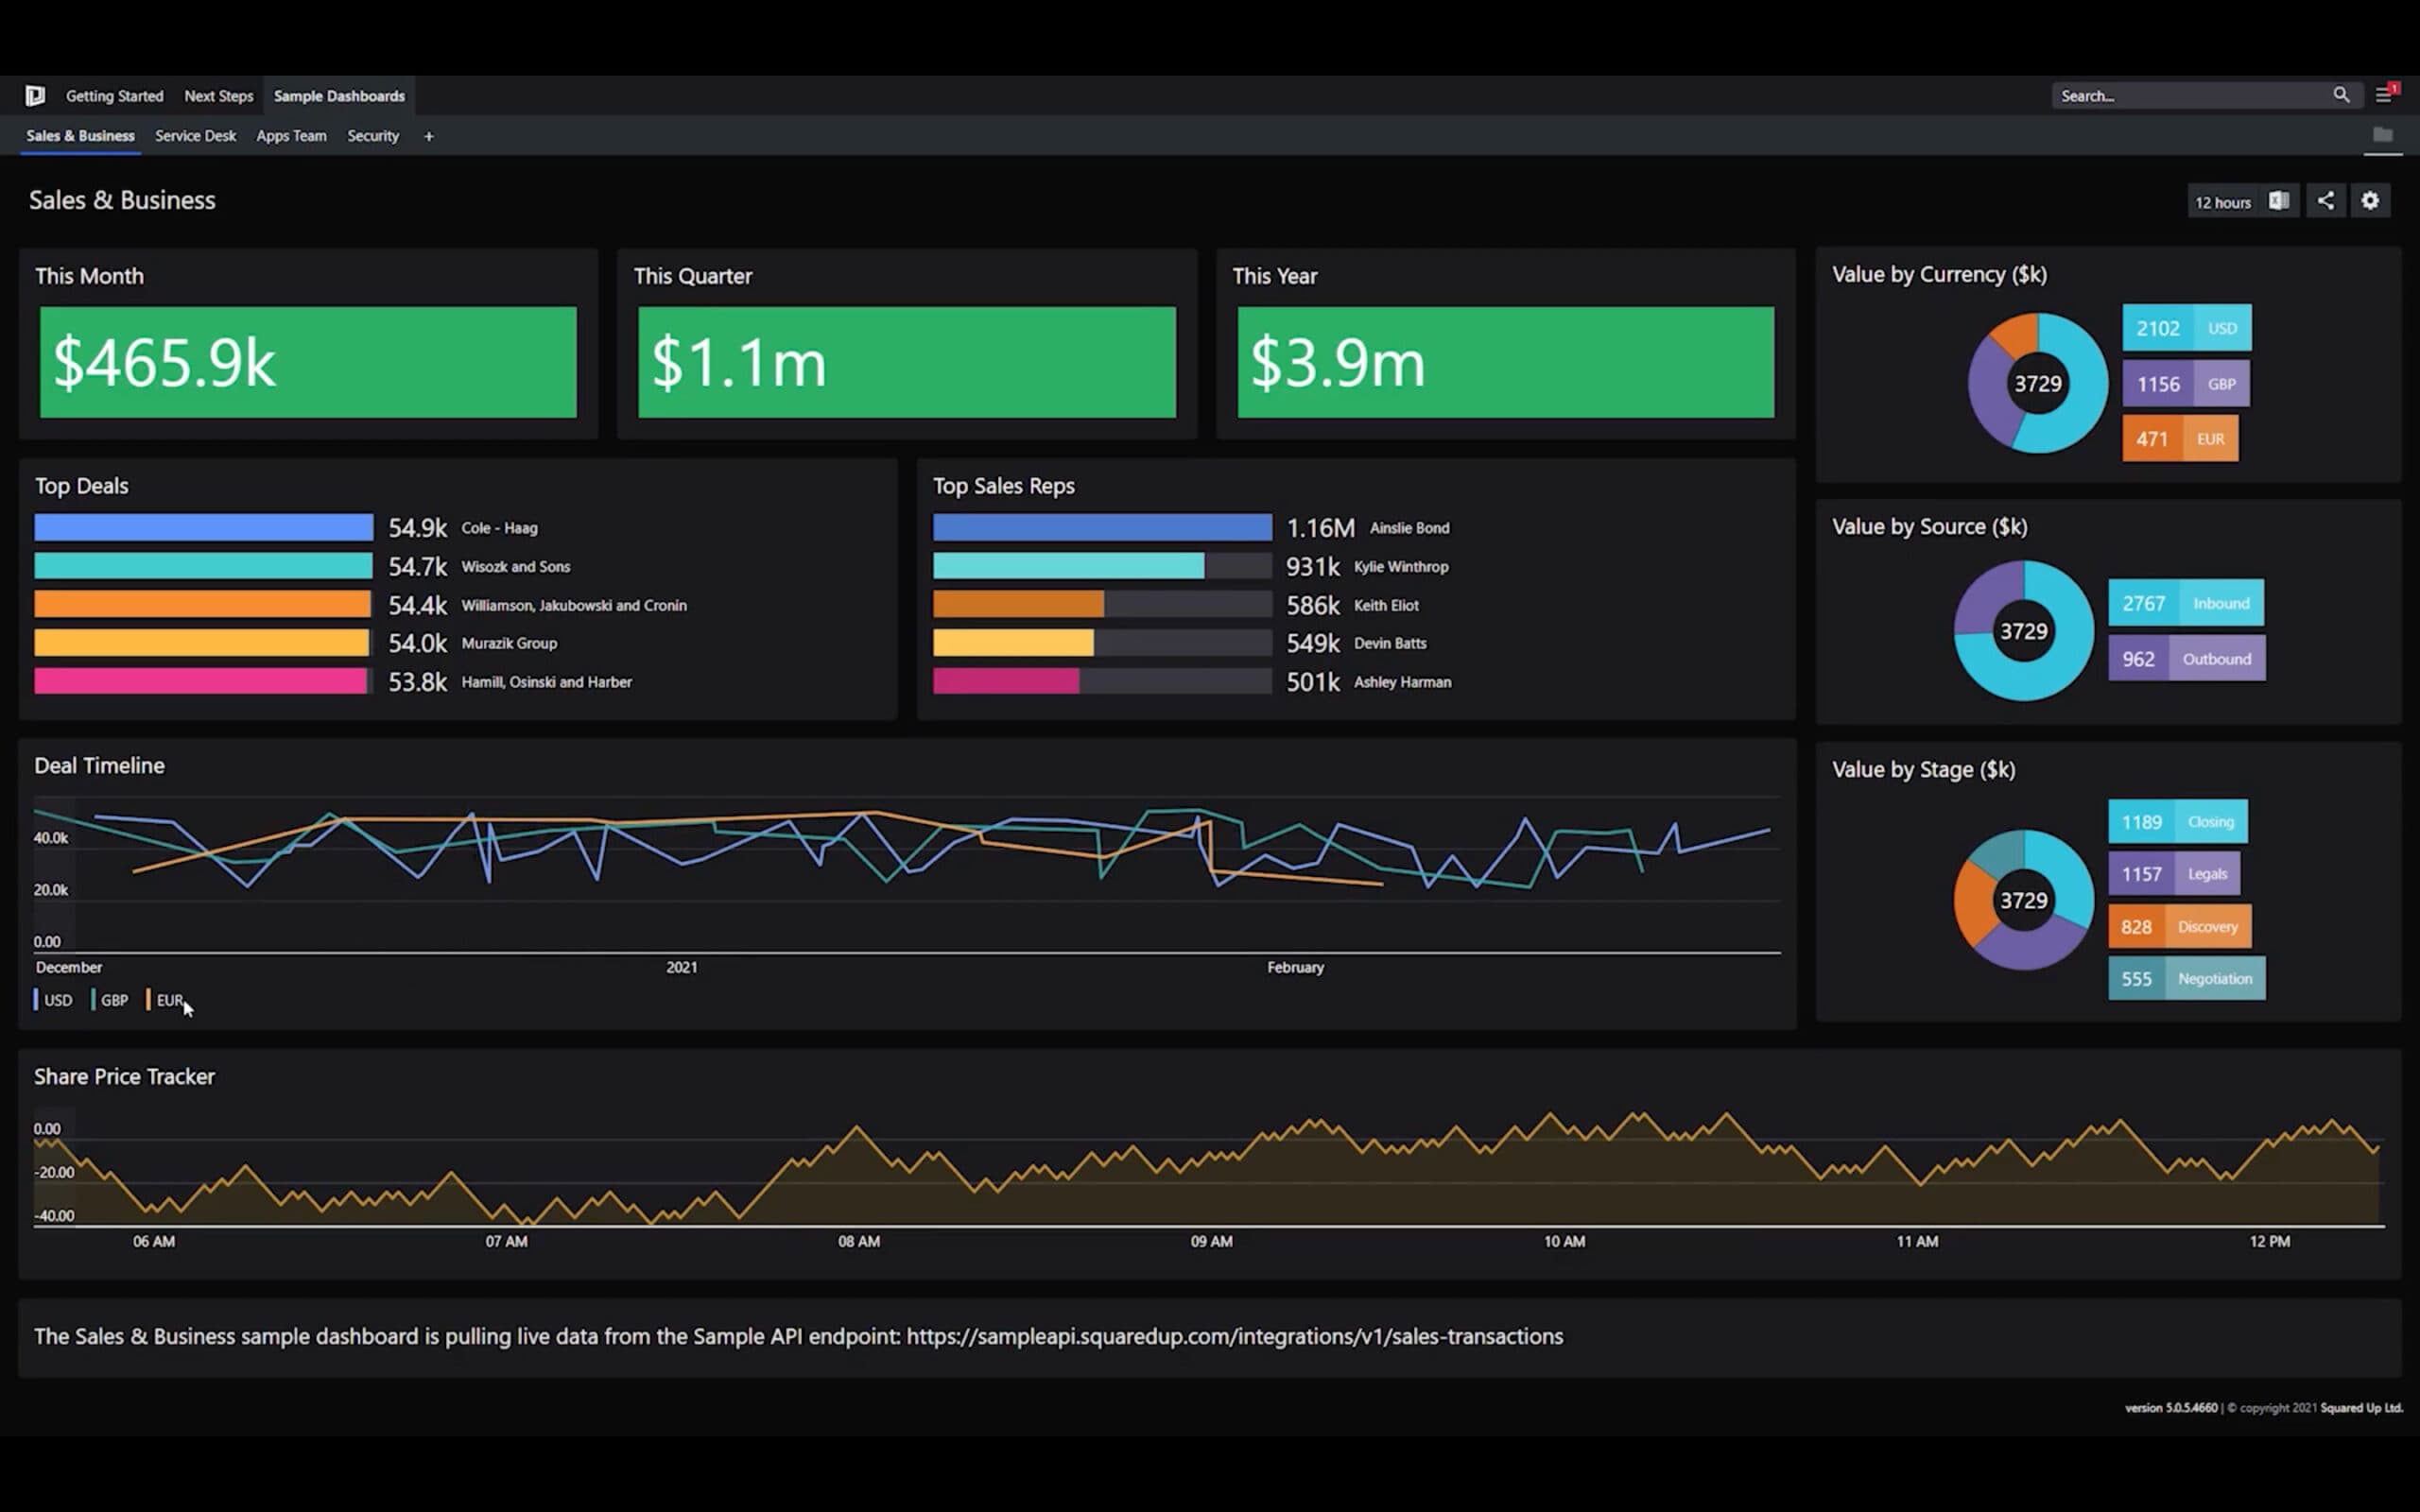
Here's a dashboard for the business team who needs to see their overall revenue as well as the pipeline and deals. This is a great overview for management.
Service Desk dashboard
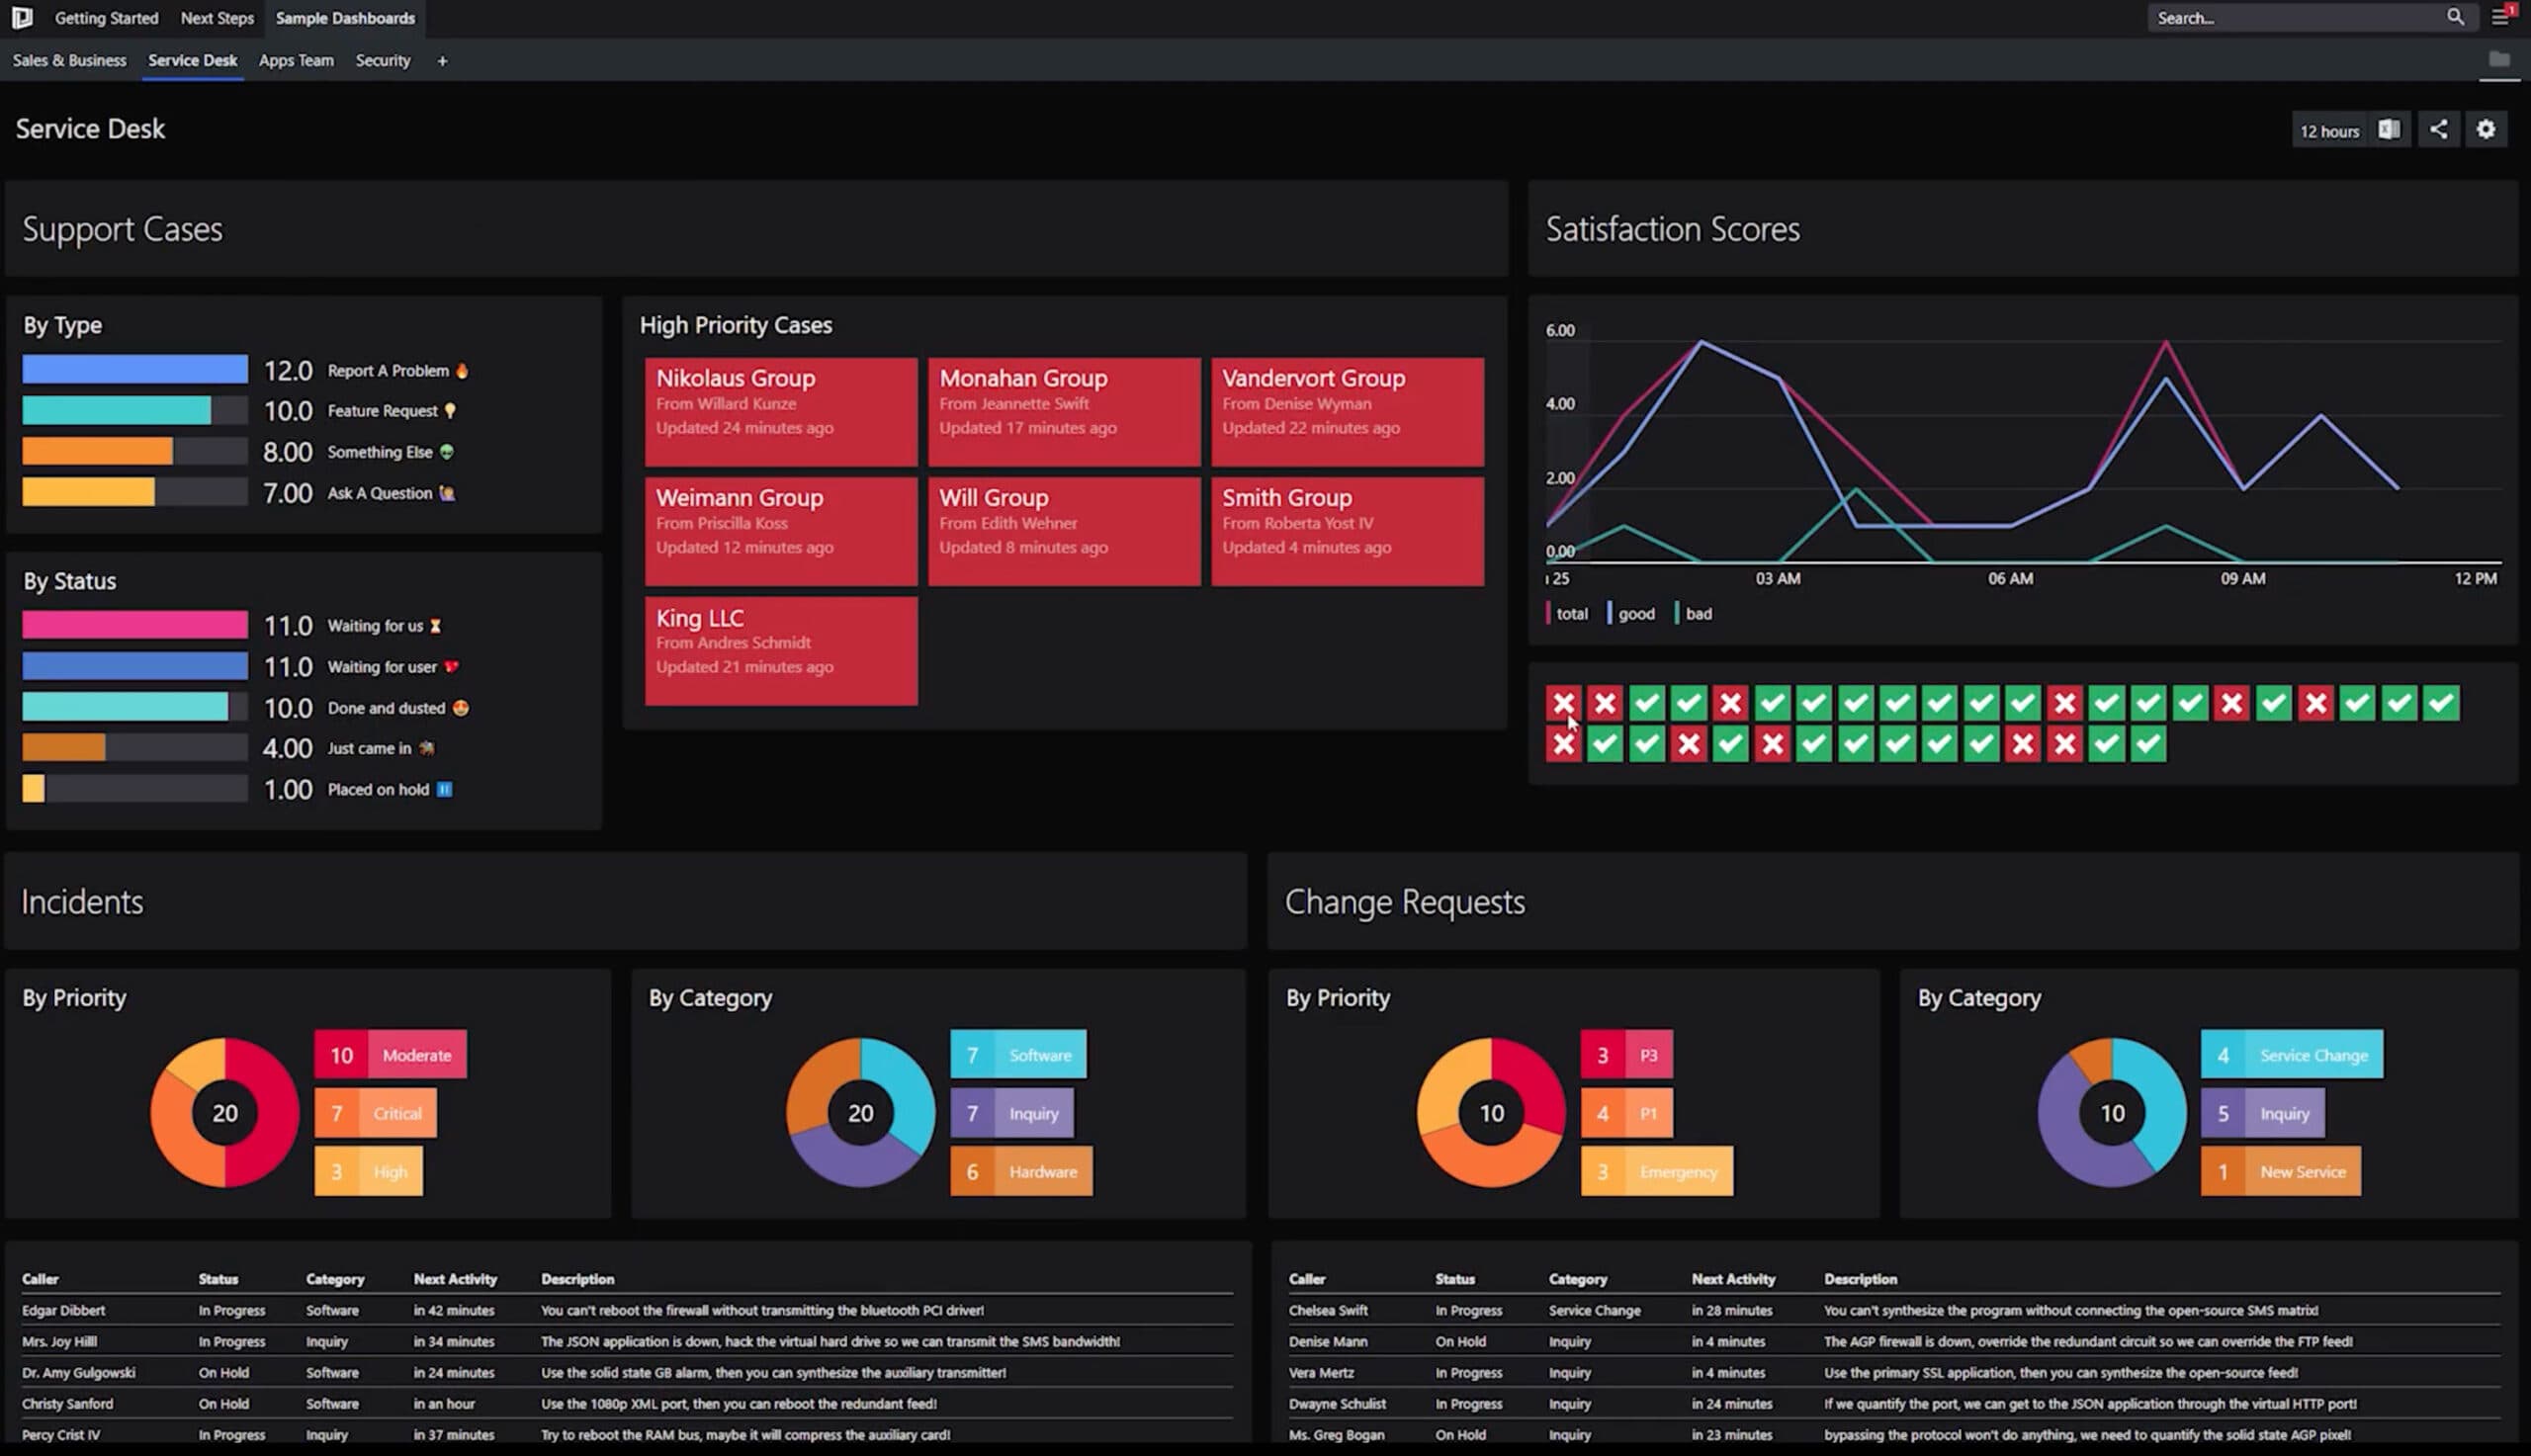
This service desk dashboard tracks support case statuses and categories, change requests, and reports customer satisfaction so the team knows exactly how they’re performing.
Application dashboard
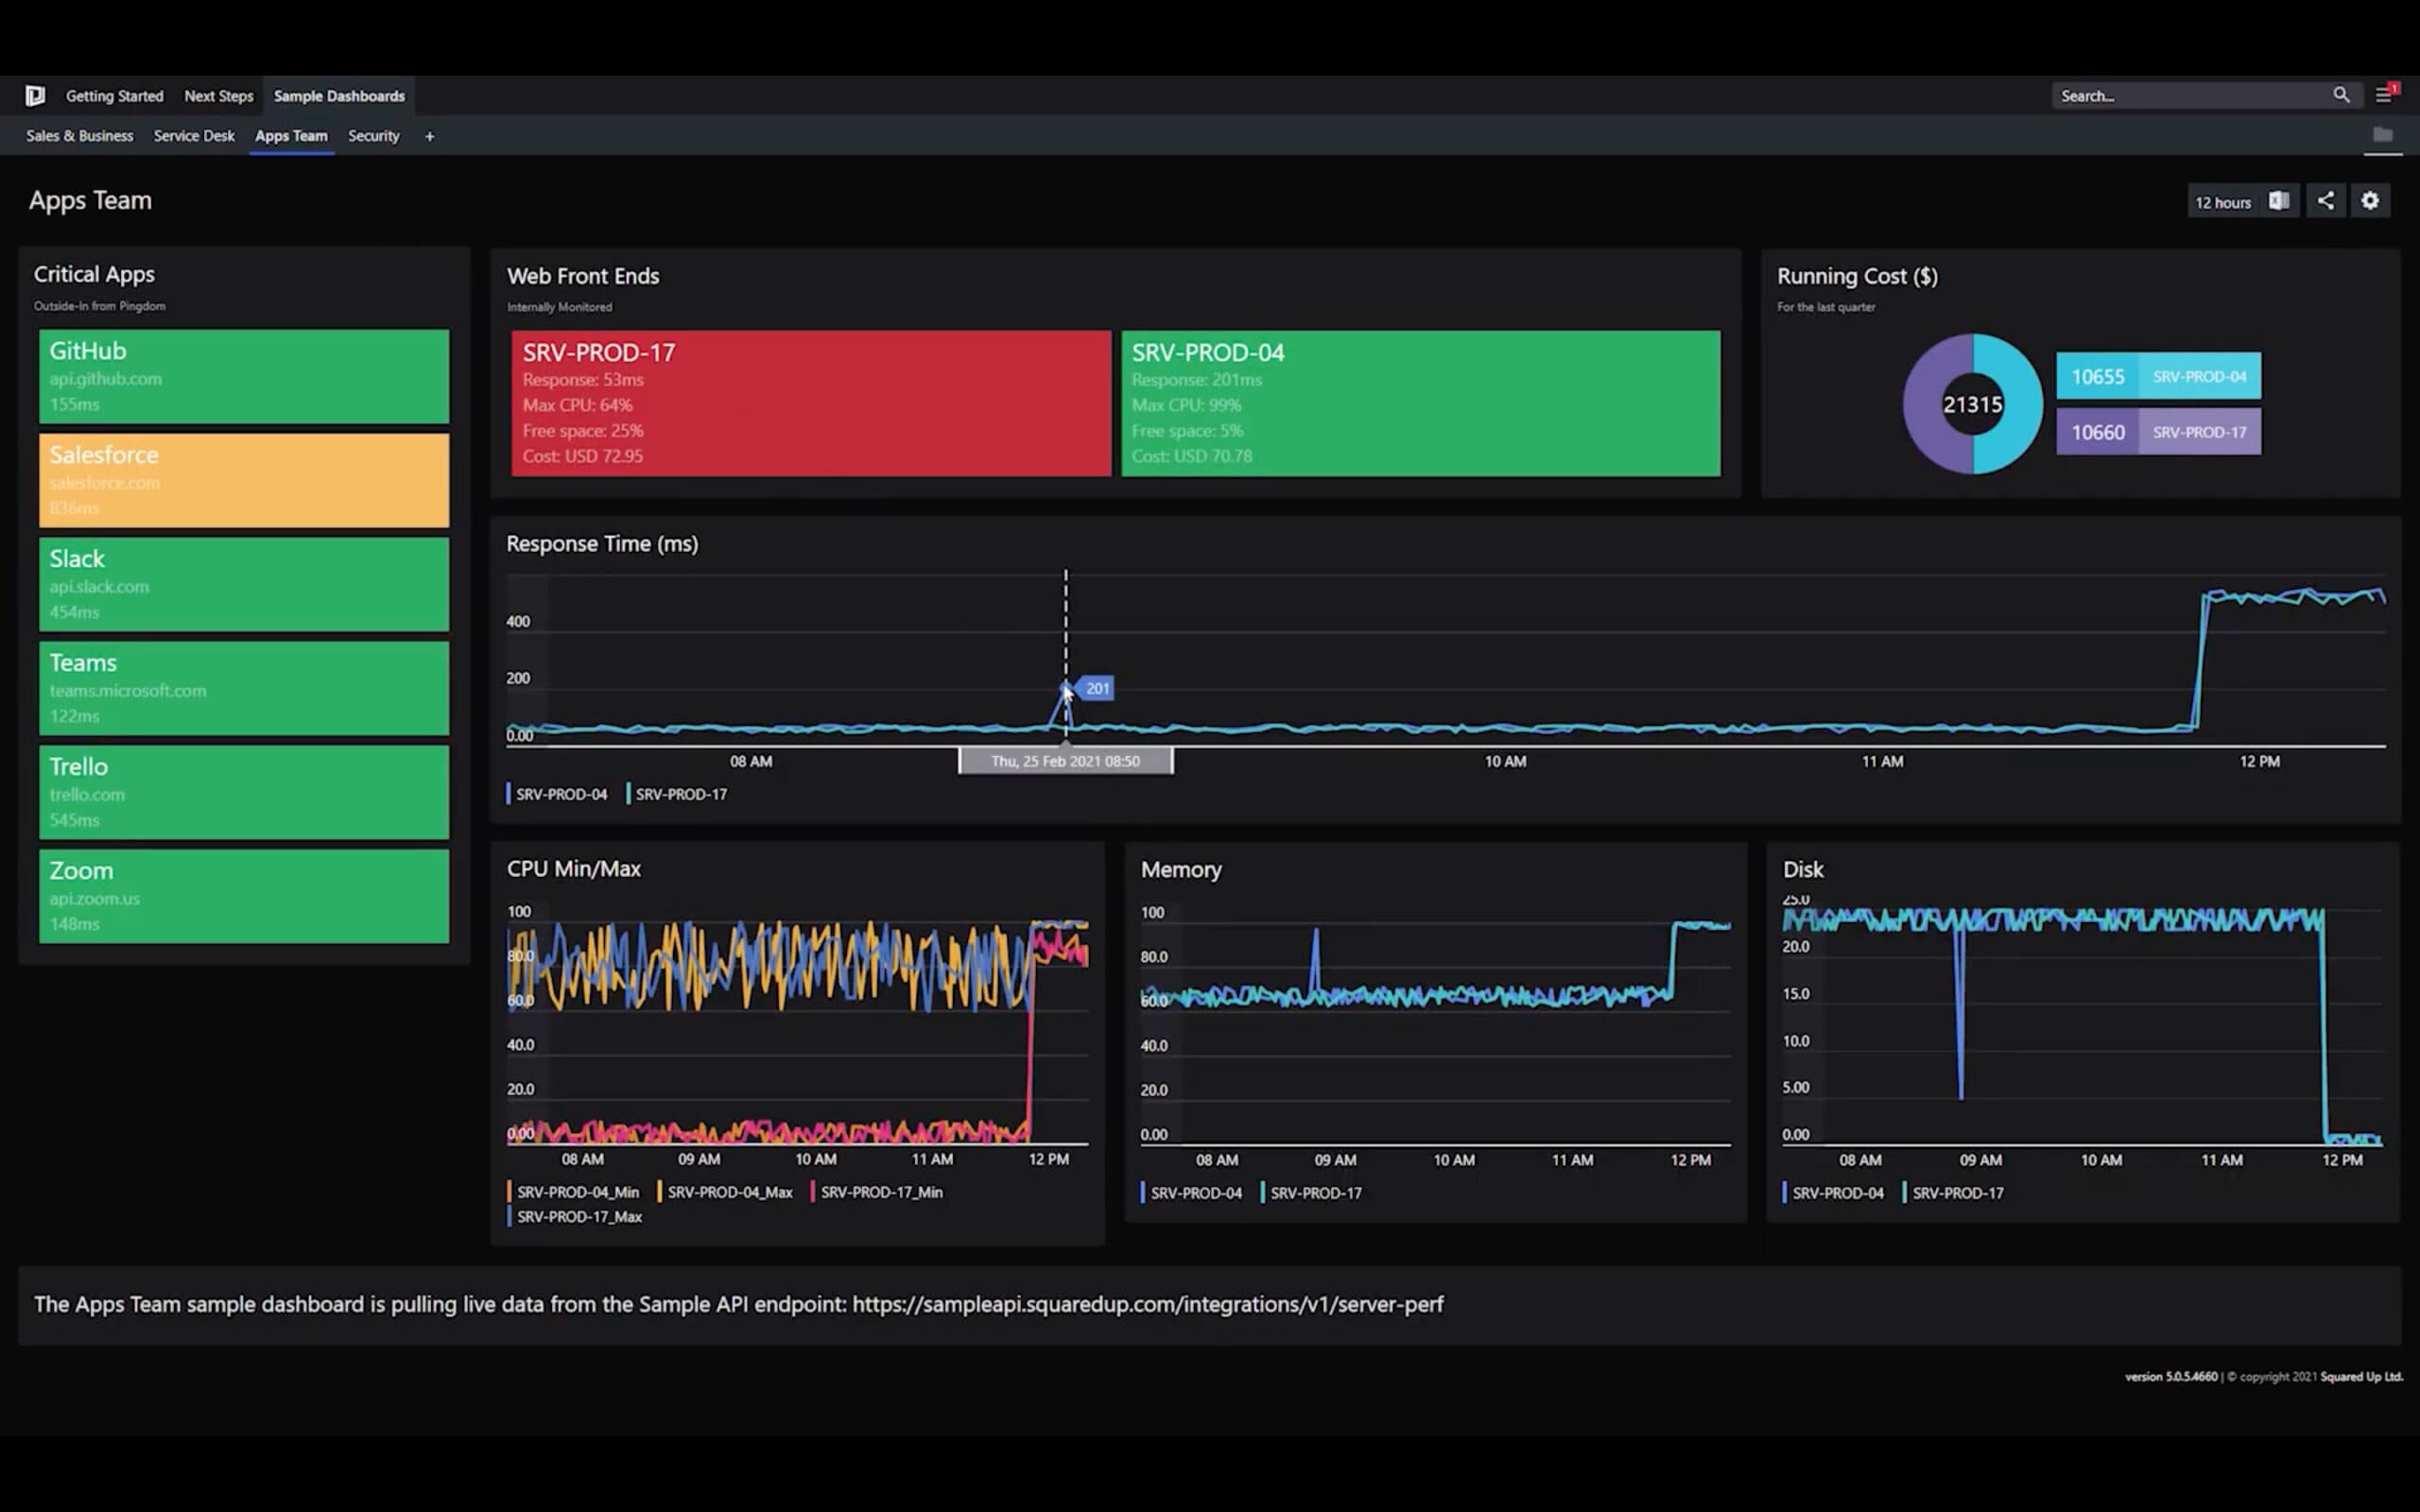
The app team needs an application dashboard to see how their app is performing for end users, as well as detailed performance metrics and running costs.
Security dashboard
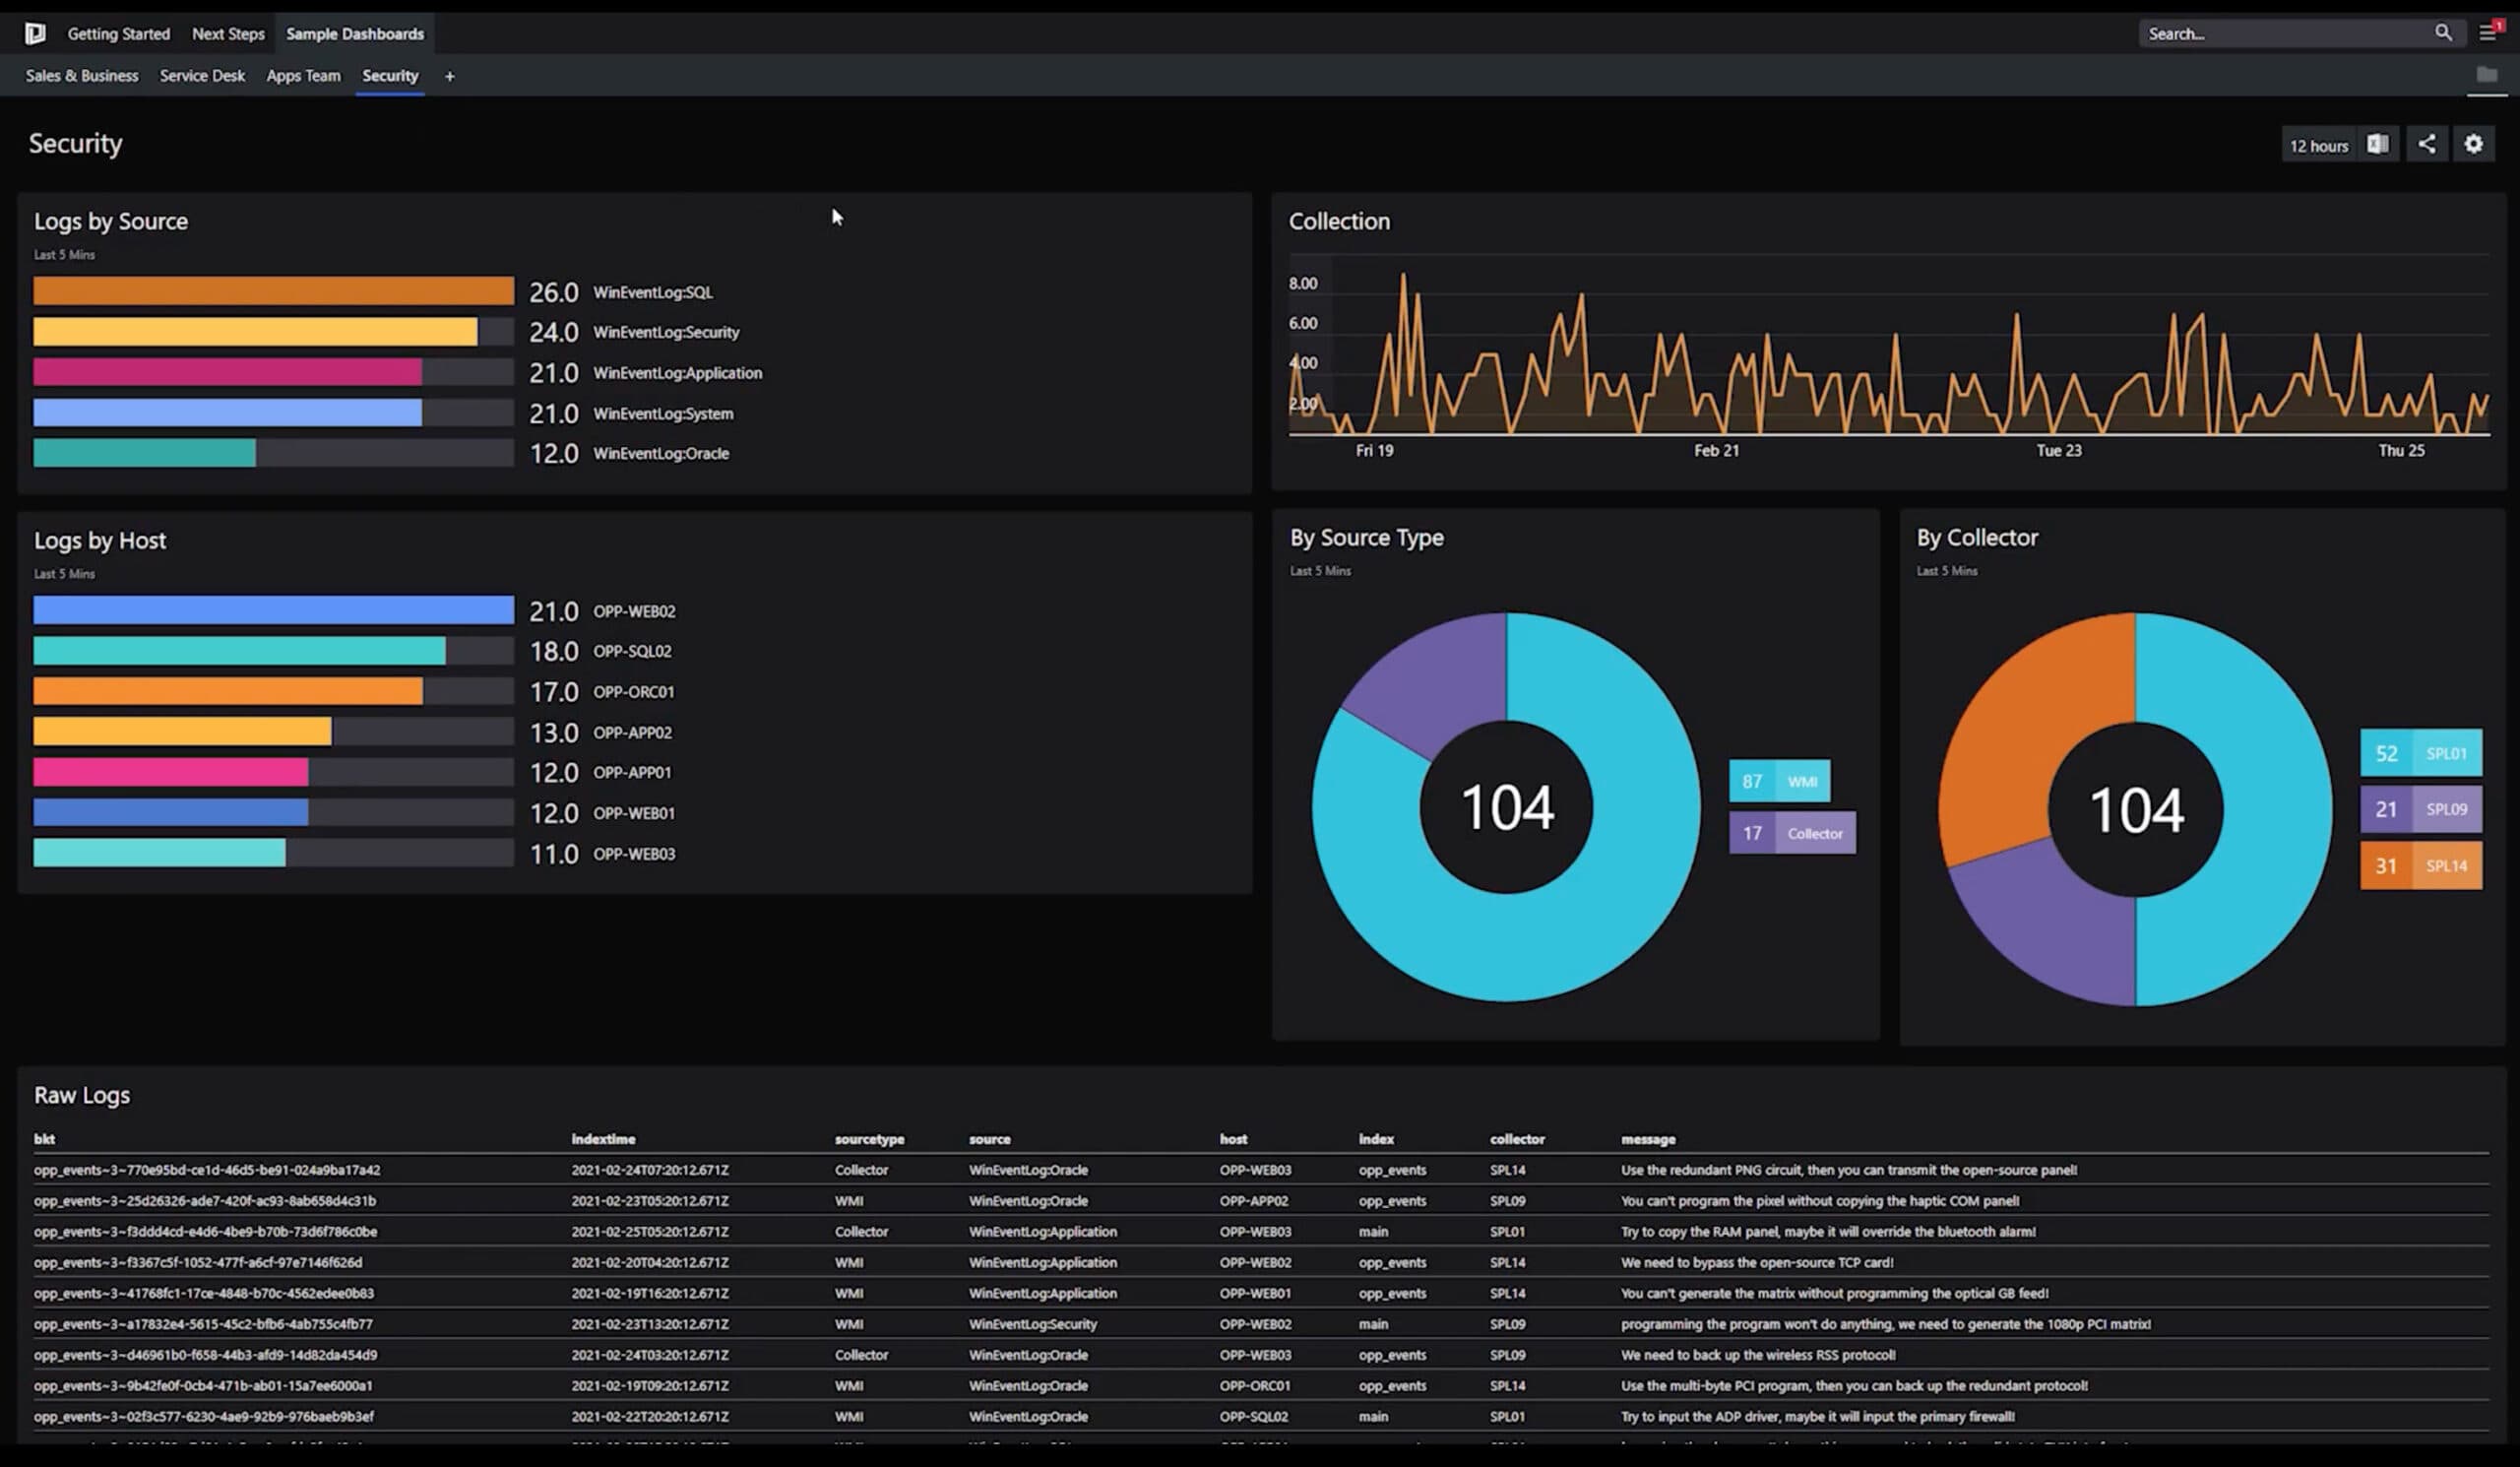
A dashboard for the security team lets them track security events and monitor logs from security tools.
These dashboards give you a live stream of real-time data direct from the source, correlated into a beautiful dashboard, providing the eyes-on visualizations that you and your teams need. No more scrambling between multiple platforms. Put all your data in one place with Community Edition.
Increase visibility with Open Access
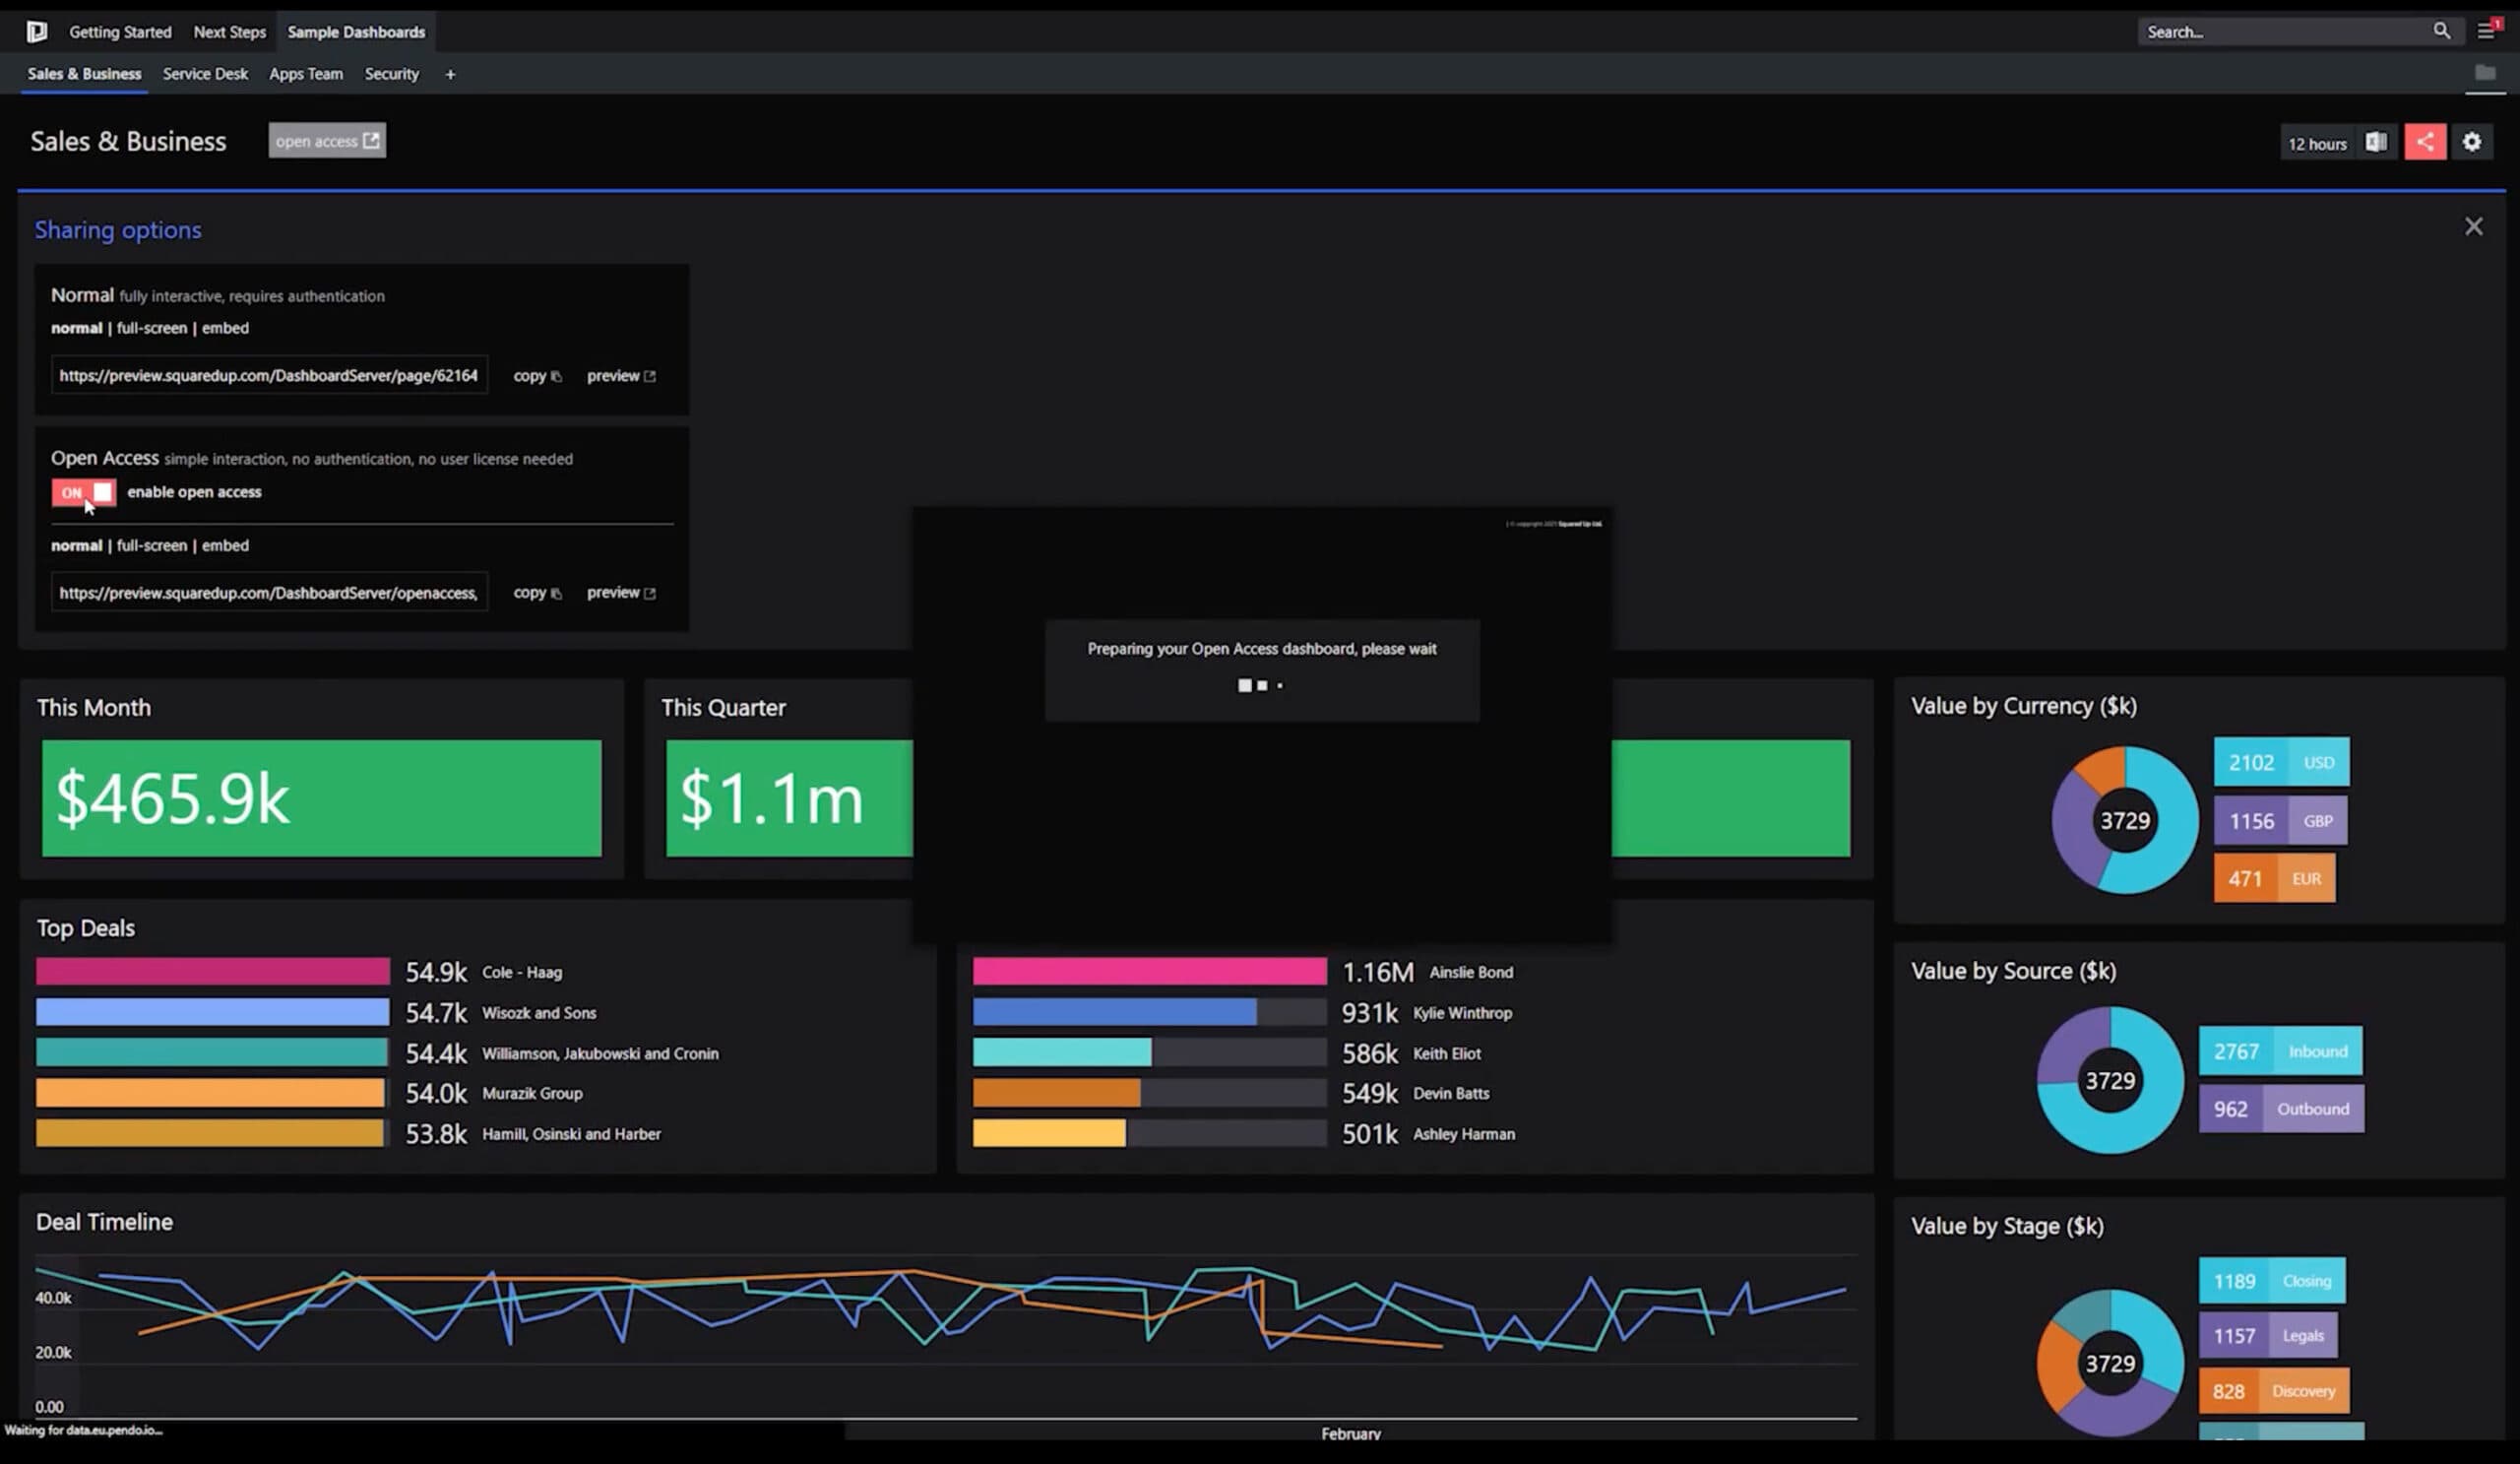
You can also share read-only dashboards to your management team or on your team’s wall screen with Open Access. It offers unlimited sharing to anyone in your organization – no extra licenses required!
You can also invite your team members to collaborate and create their own dashboards.
Next steps dashboard
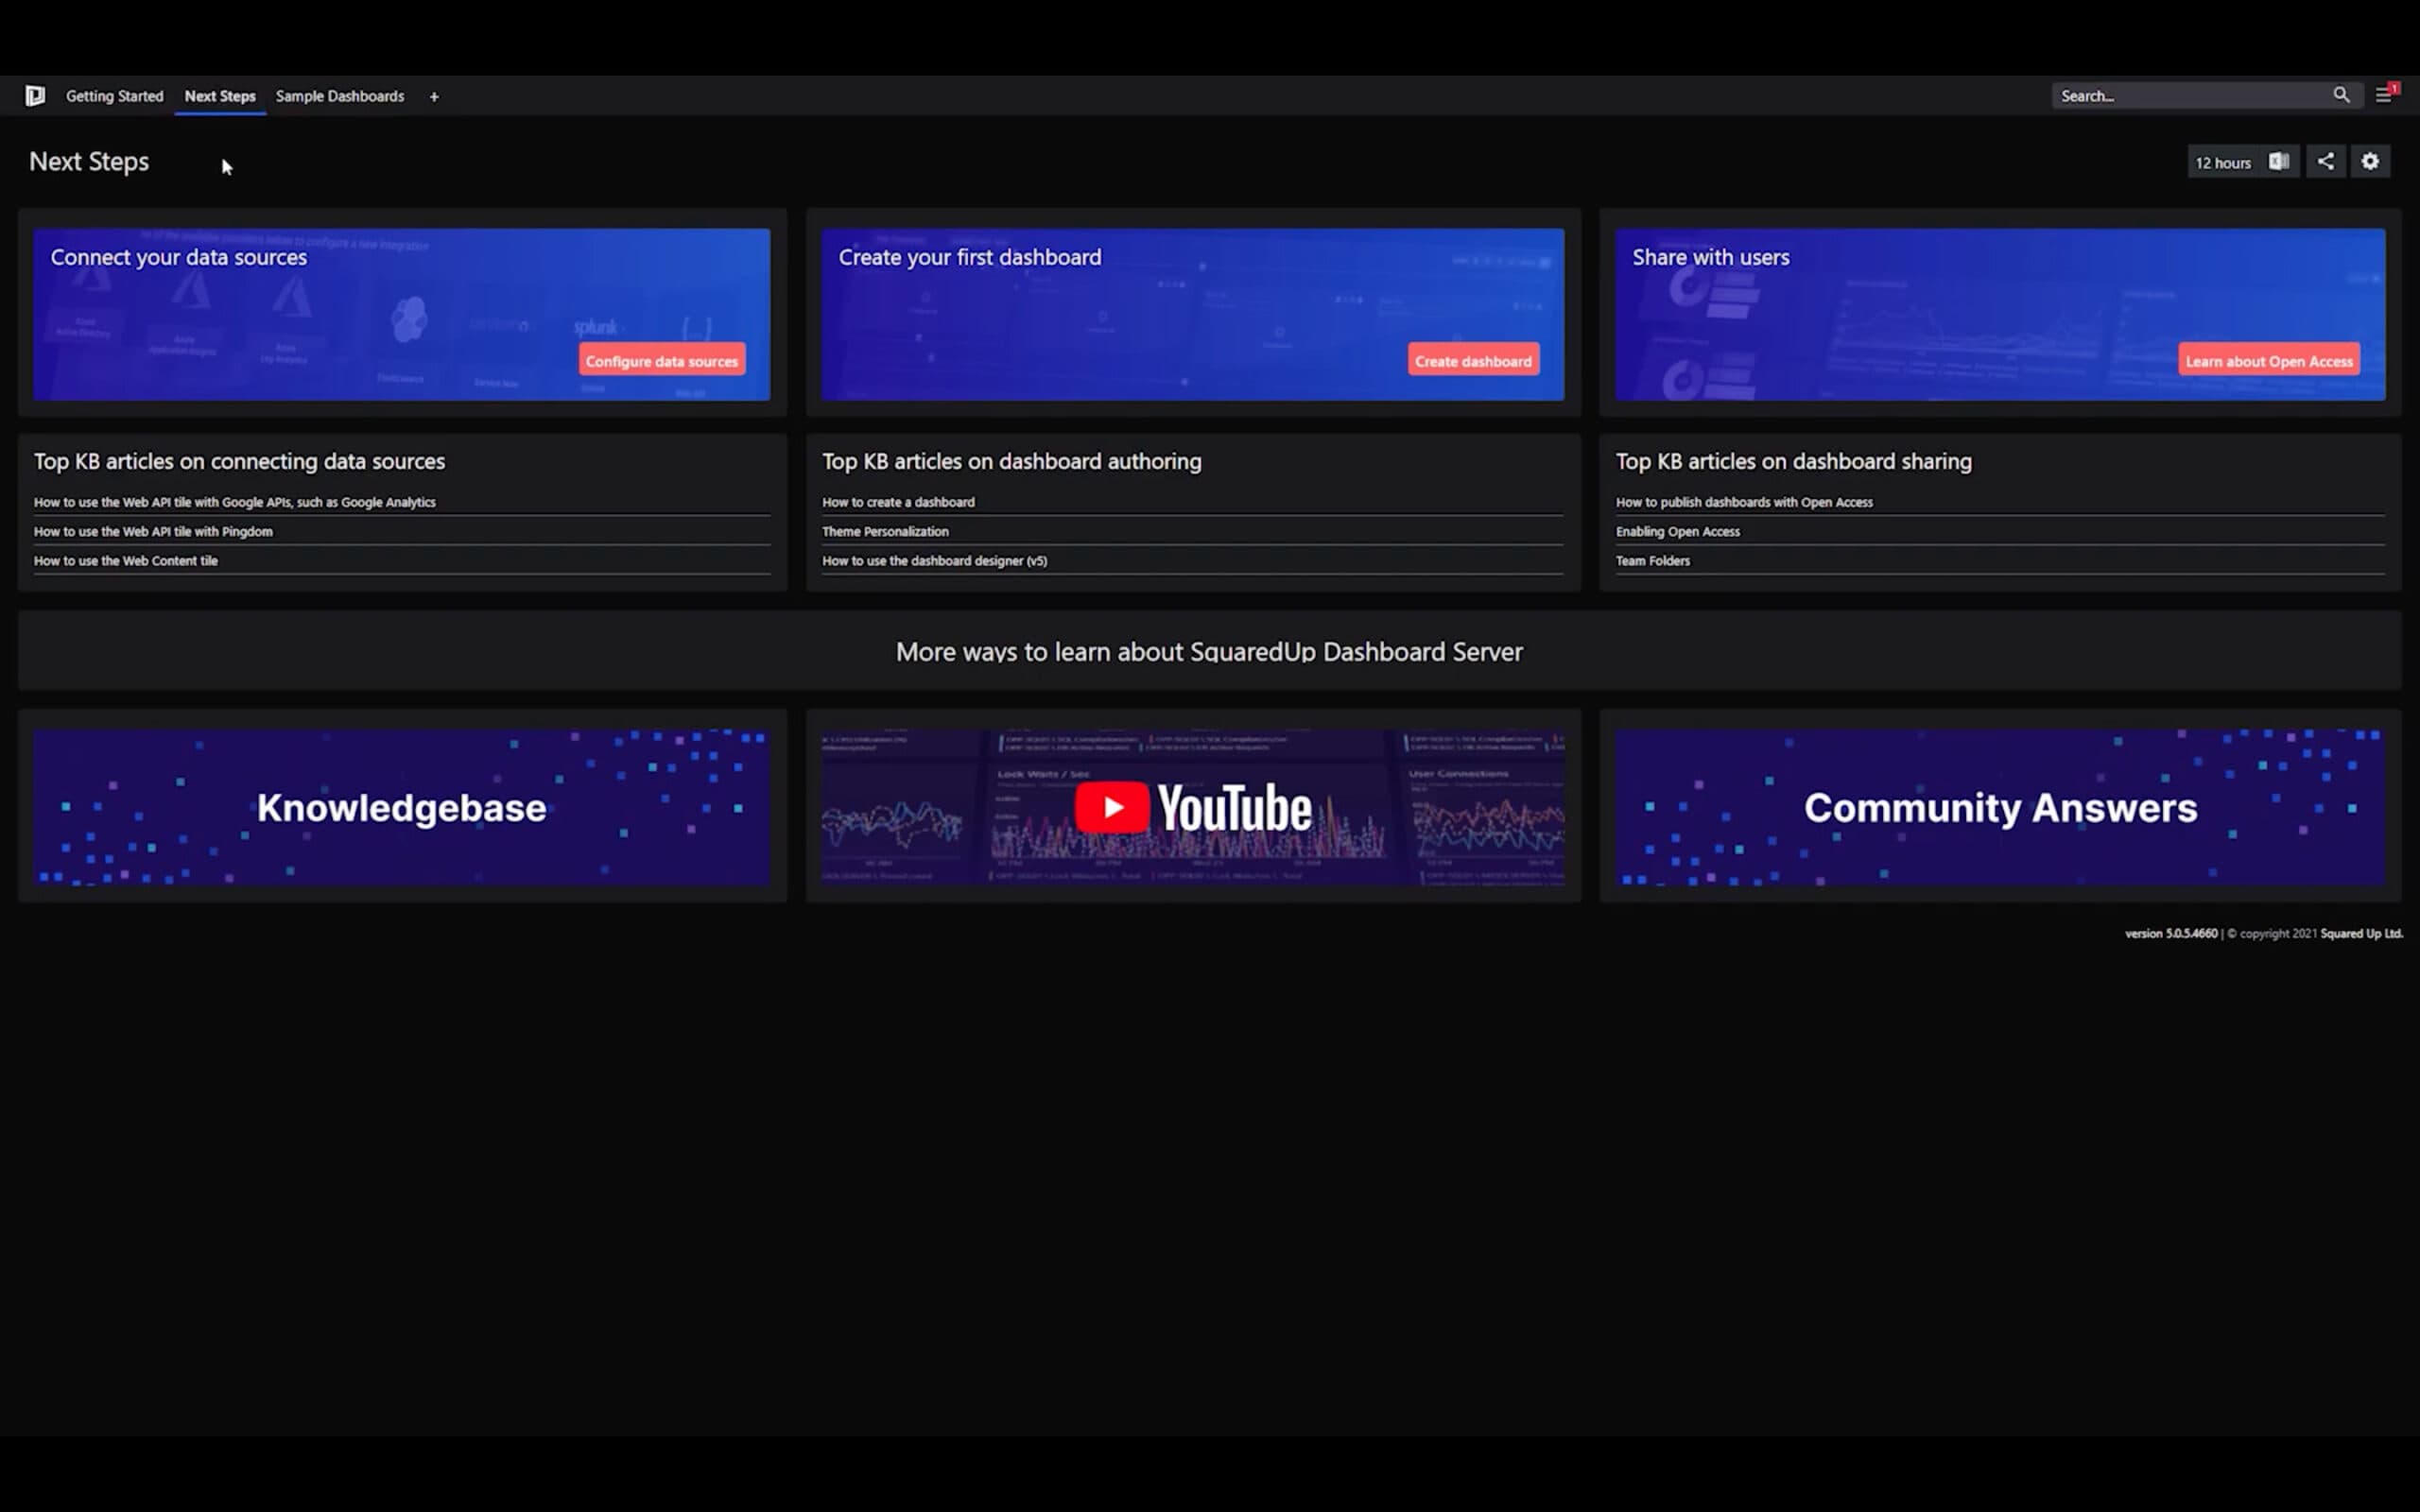
The Next Steps dashboard contains links to useful resources, including our knowledge base, and community support platform Community Answers, where you can get all your questions answered and discuss data visualization with peers and SquaredUp experts.
When you are ready to start creating your first dashboard hit that + button.
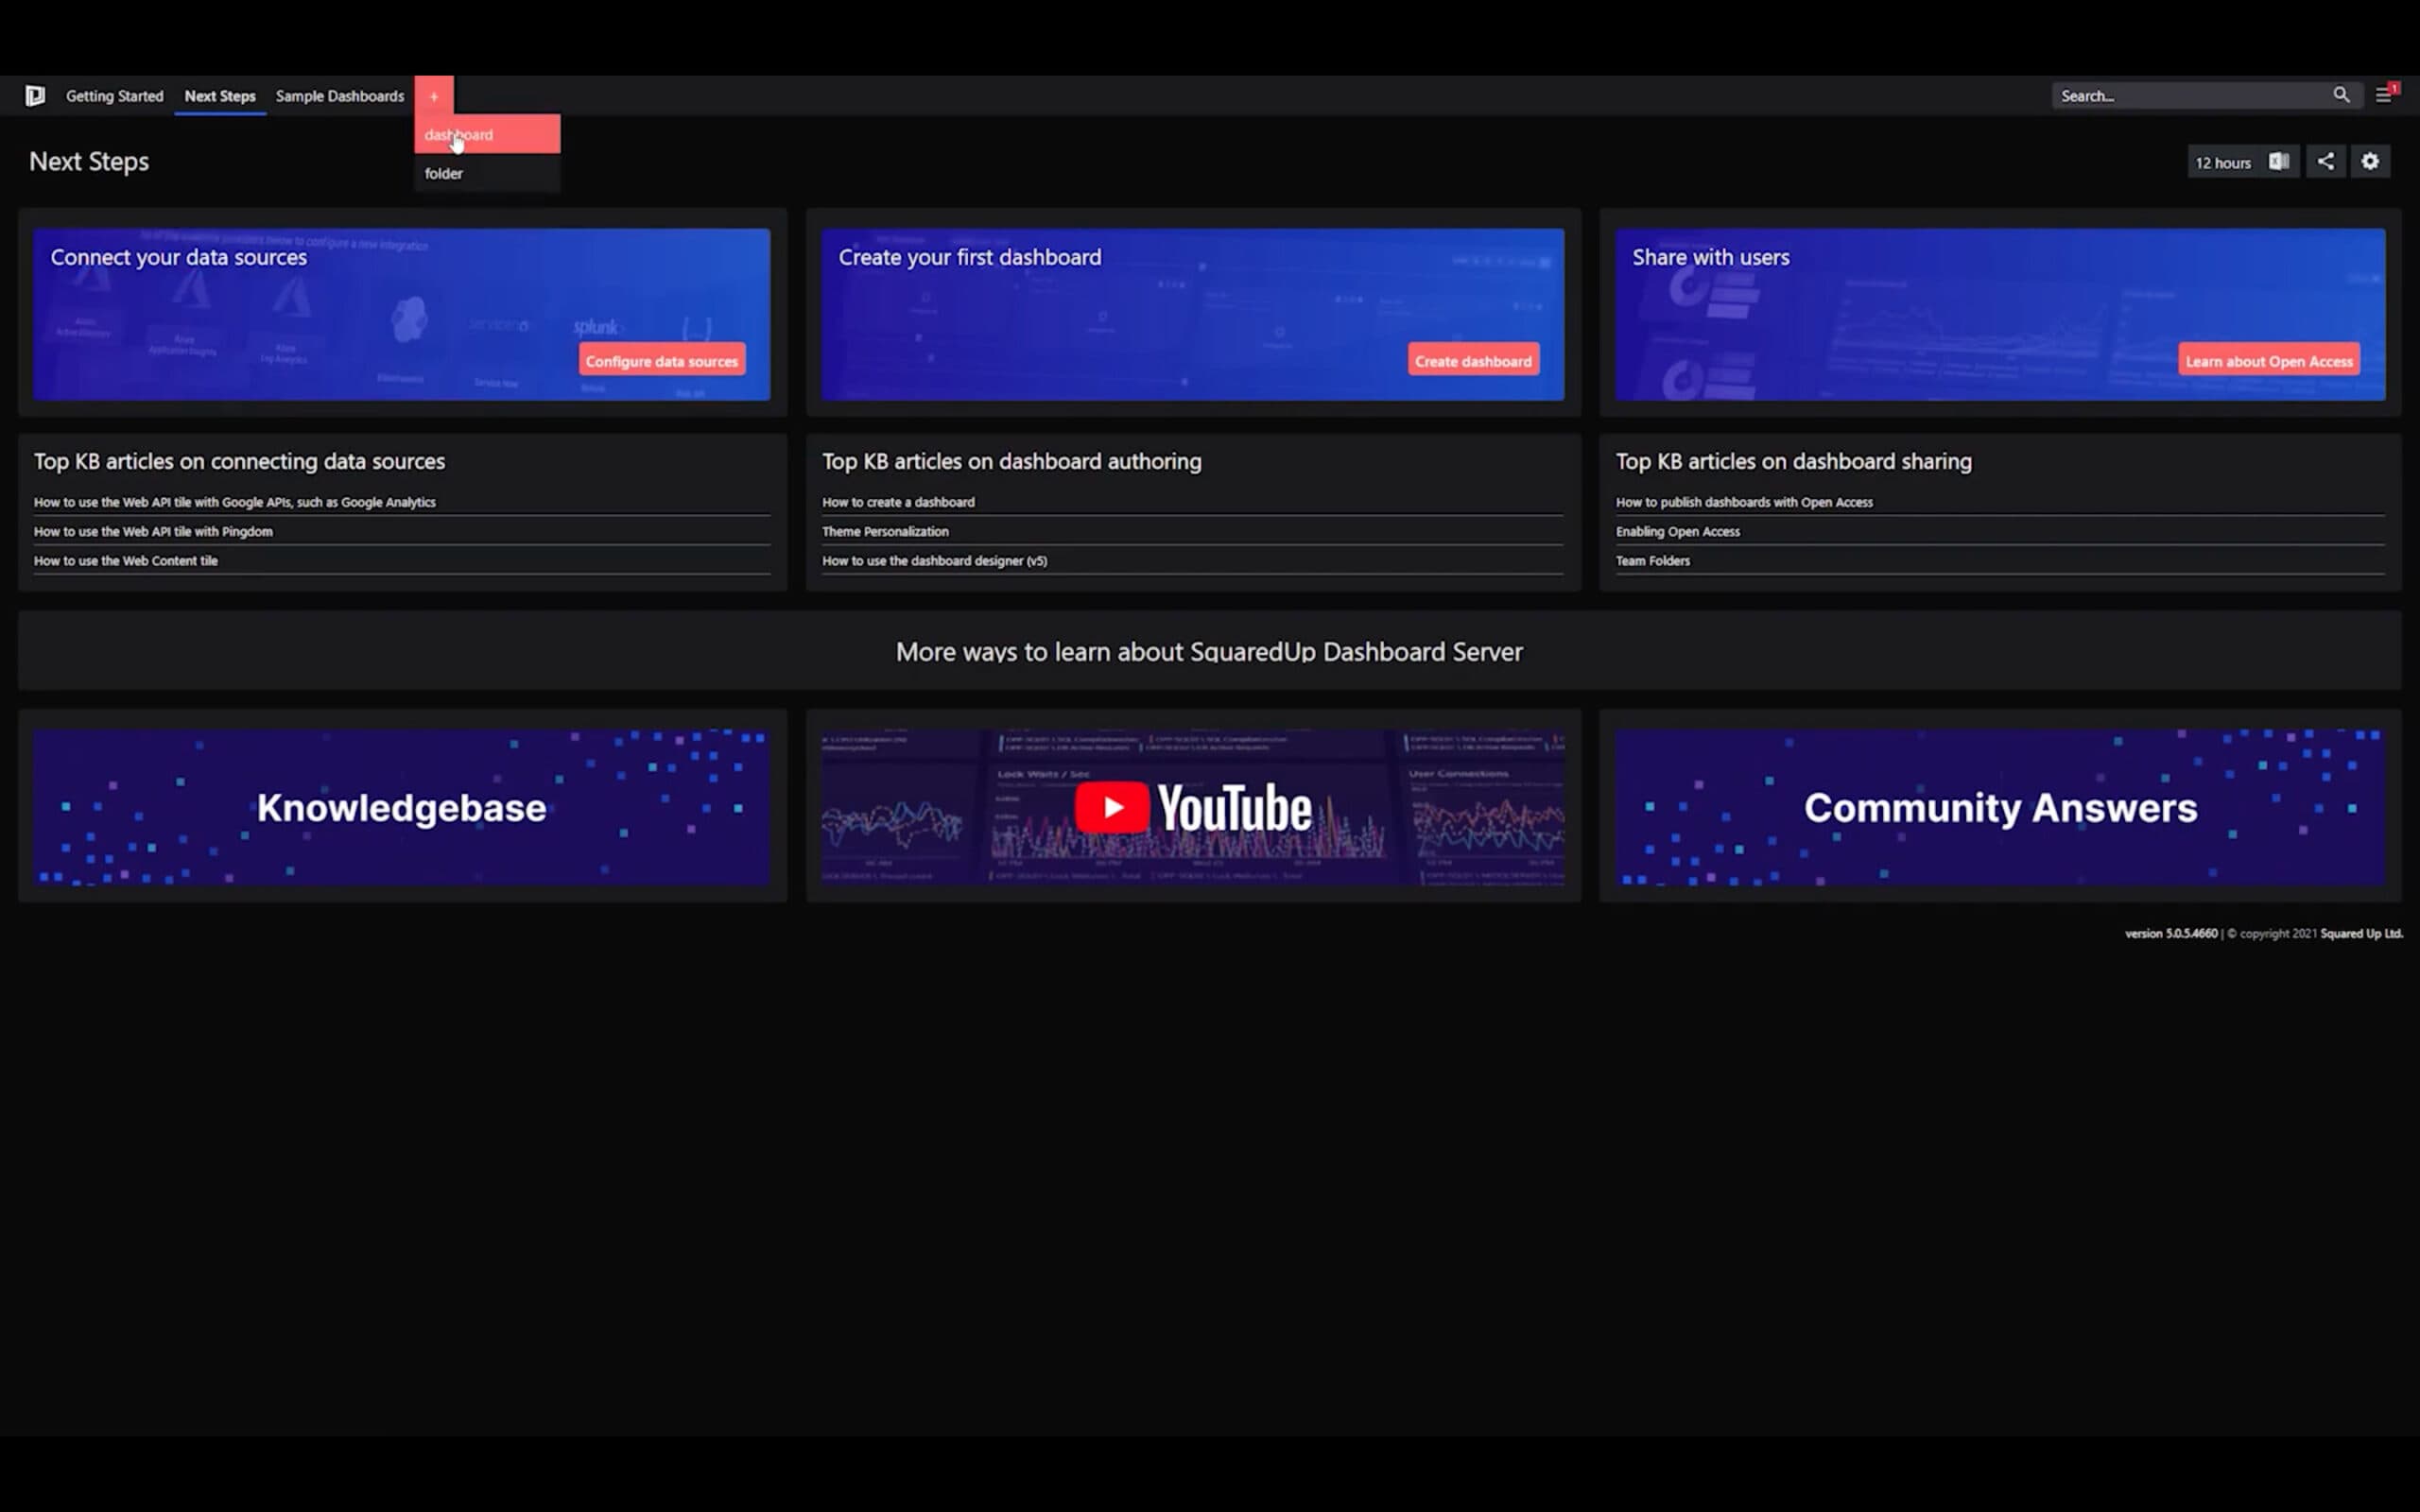
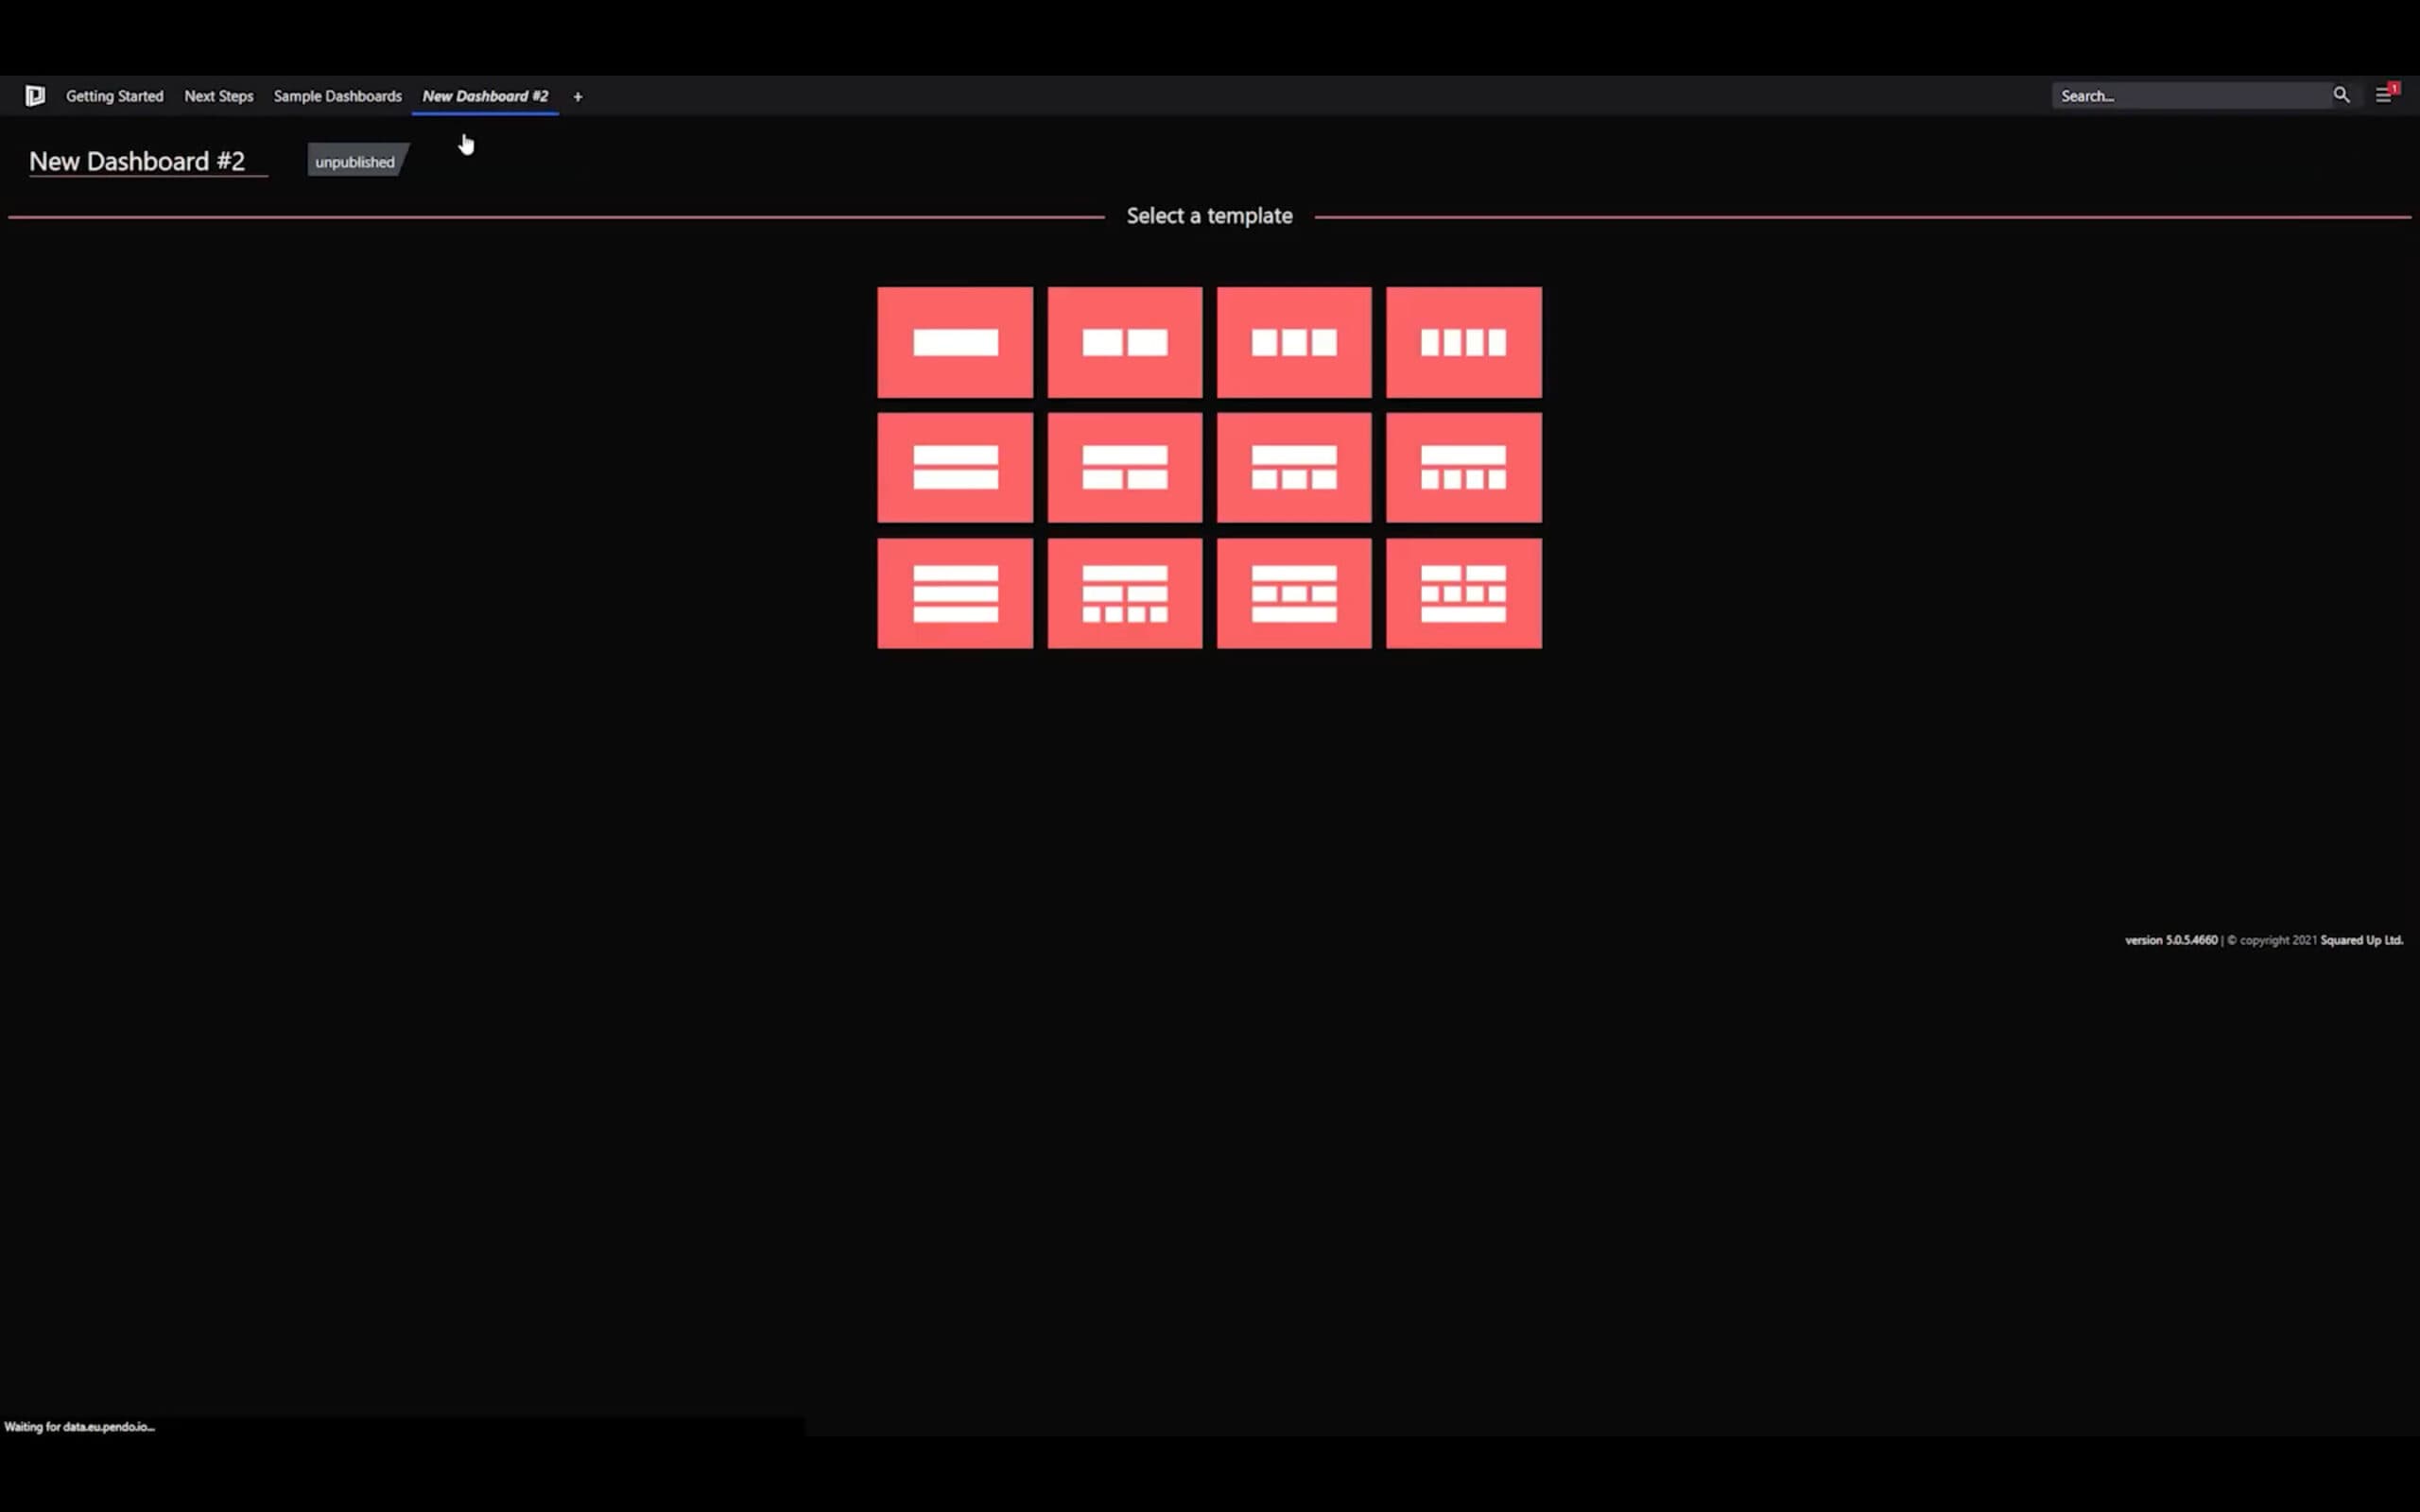
You can build an unlimited number of custom dashboards using the intuitive HTML5 Dashboard Designer and set up as many integrations as you need.
Use the Web API tile to connect to any tool or system with an API endpoint or use a PowerShell or SQL script to drive the visualizations.
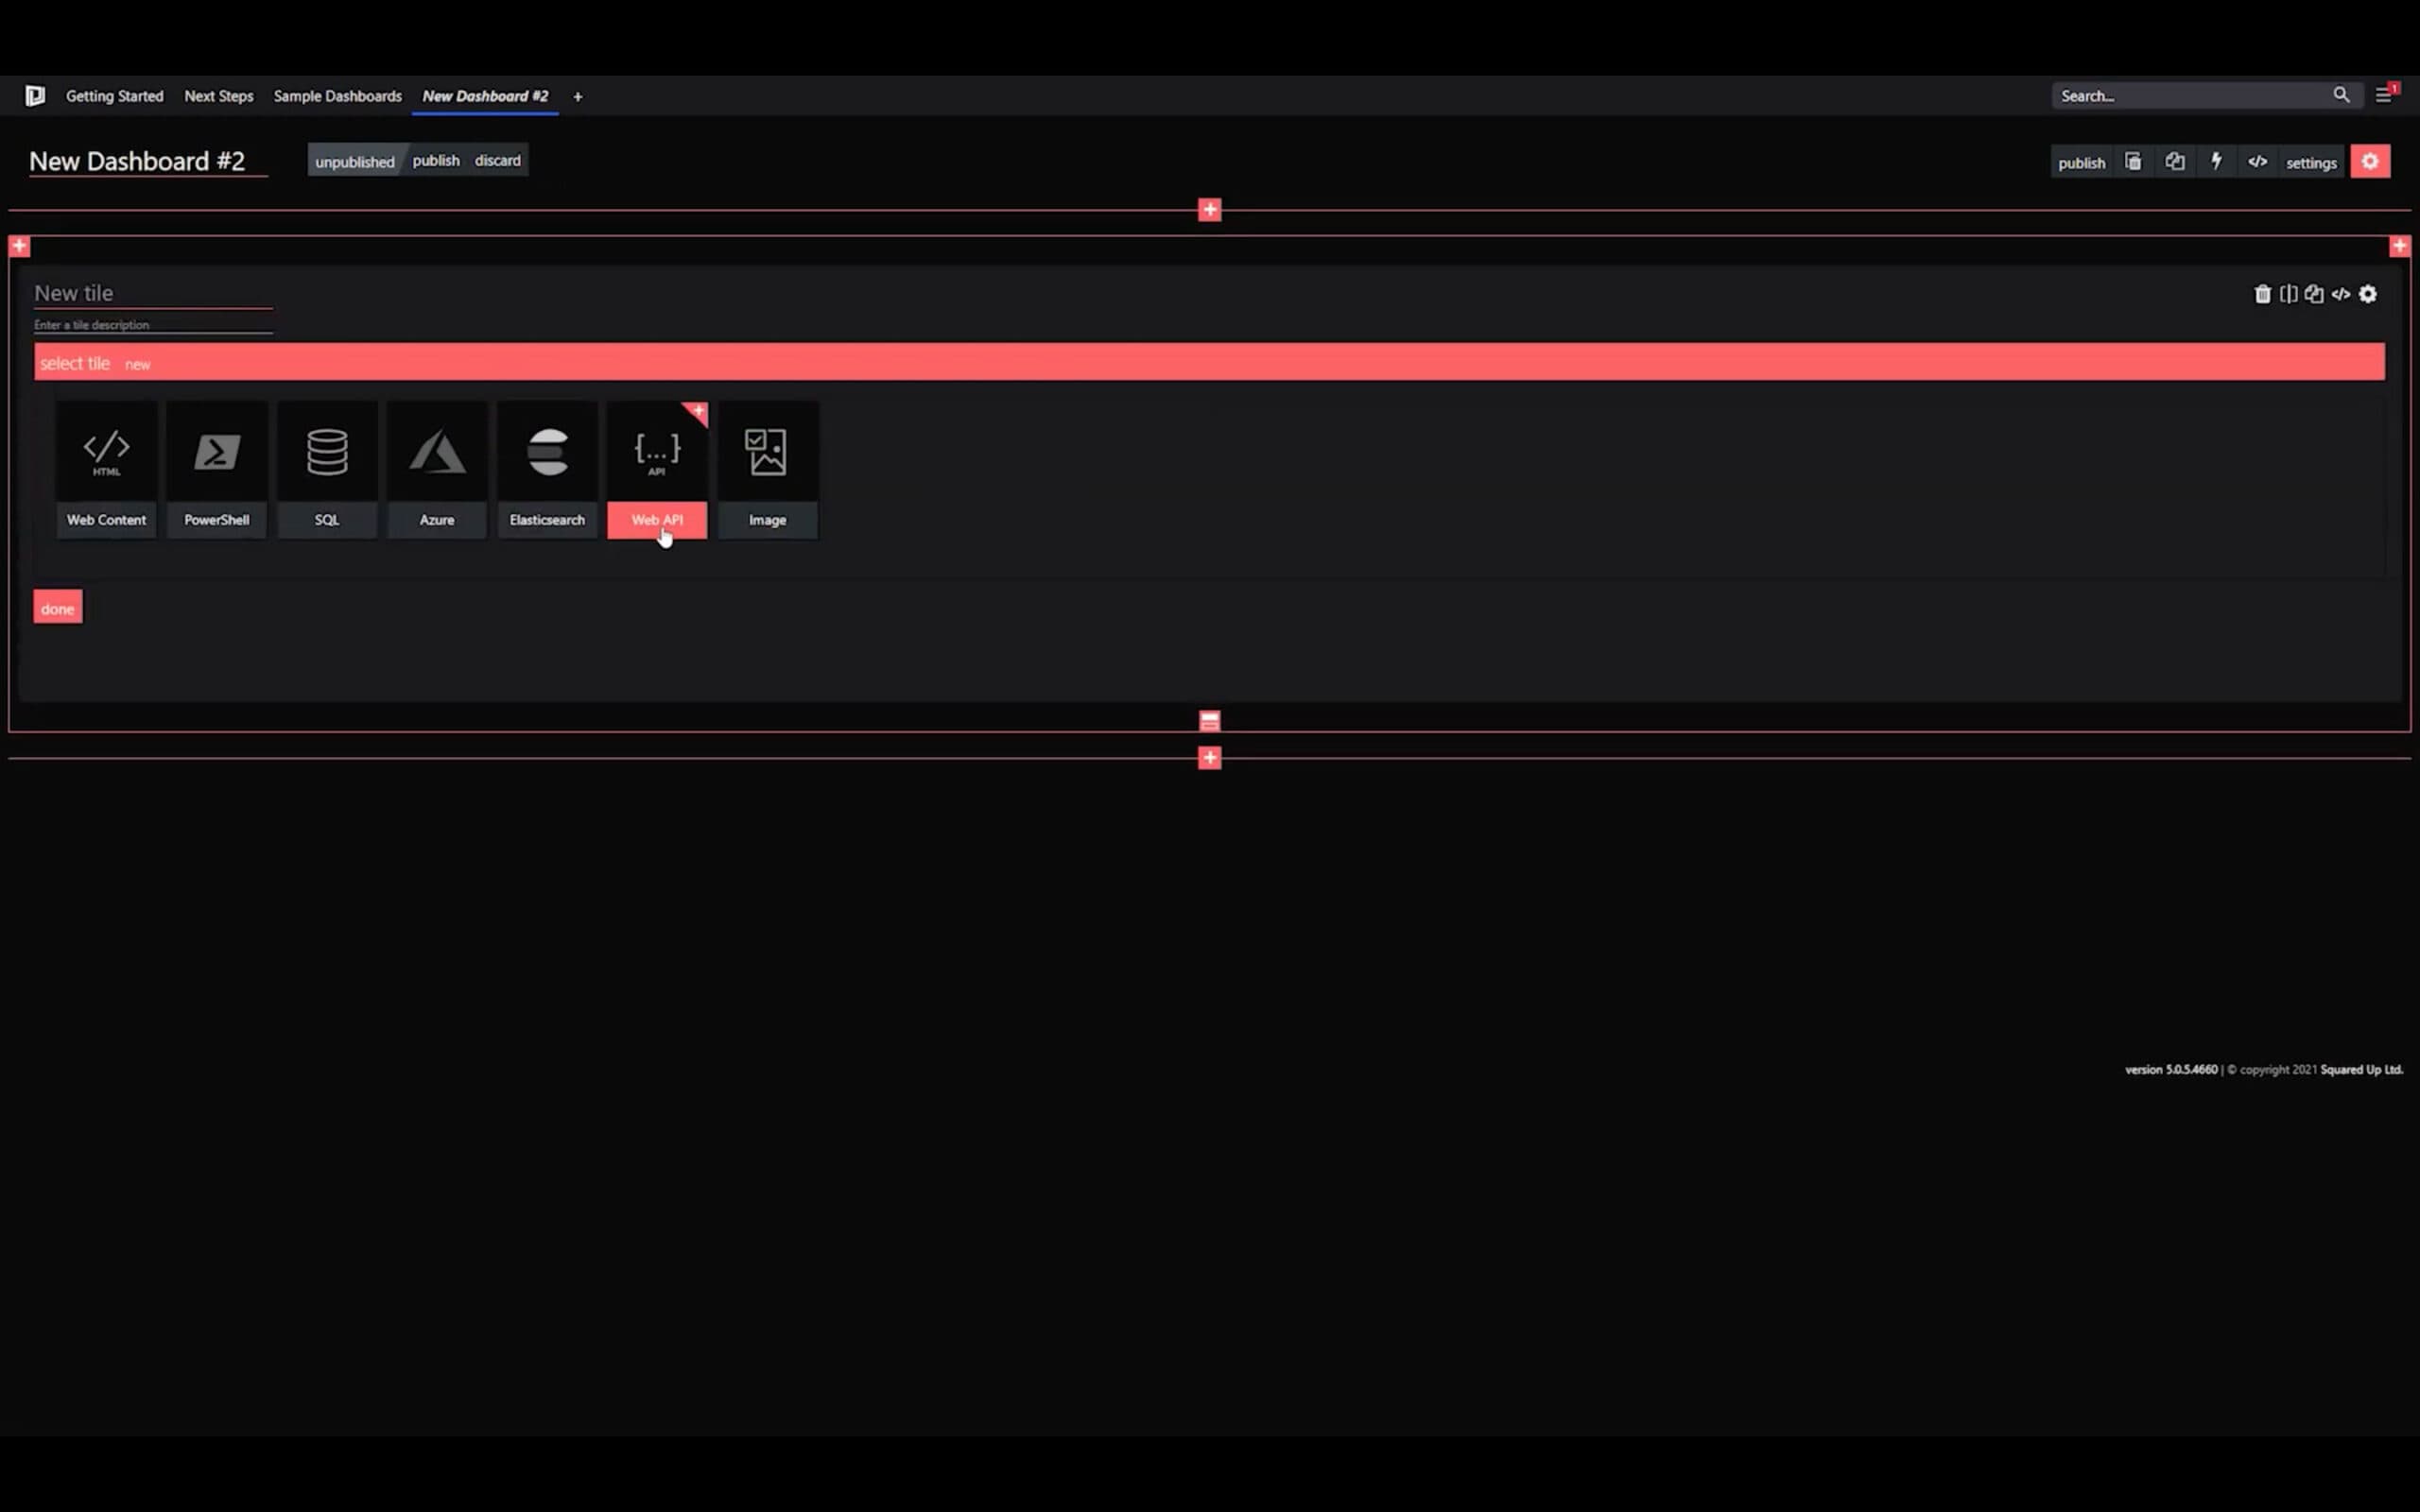
You can also connect to Elasticsearch, Azure Log Analytics, and more, allowing you to dashboard on top any of your favourite monitoring tools.
Happy dashboarding!
See the next part in this series for a walkthrough on “How to create your first dashboard”.
To learn alongside a friendly face, check out our Tech Evangelist Sameer's Community Edition Learning Path. Join him as he discovers all there is to know about our new product!