
Sameer Mhaisekar
SquaredUp, Technical Evangelist
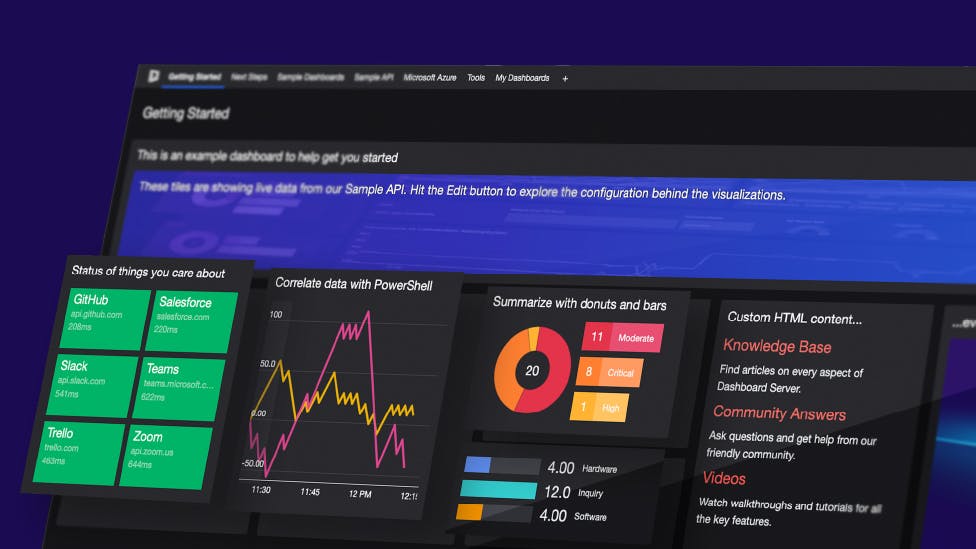
In this part of the Community Edition Learning Path, let’s take a look at the Azure tile. This tile will allow you to connect to and query App Insights and Log Analytics workspaces using Kusto Query Language( KQL), which offers features such as sorting, projection and calculated values, which we can use to control the display of data in our dashboard.
Note: the Azure App Insights tile is only available in the Enterprise version of SquaredUp Community Edition
If you are new to KQL, We have a series of blogs that can help you get started.
Get the jumpstart guide to KQL
In SquaredUp Azure Edition, you will see two separate tiles – App Insights and Logs – to get data from Azure. In Community Edition however, the App Insights and Logs tiles are brought together under a single Azure tile.
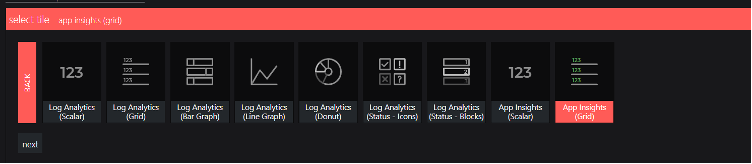
The Azure tile provides different data visualization options for Log Analytics and App Insights:
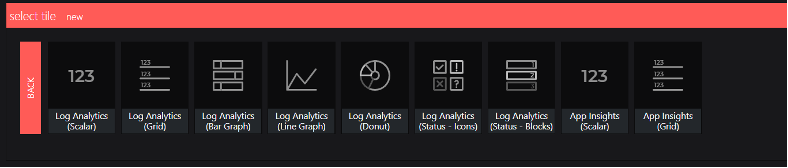
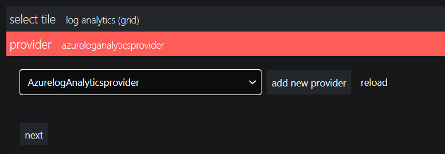
Let’s start with a simple tile. I’ll choose the Log Analytics Grid visualization for now.
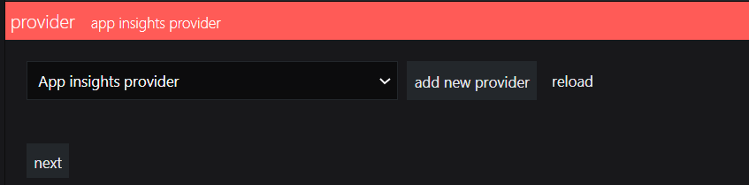
But first we will have to configure a provider for this. Click on "add new provider" in the providers section, which will take you to the Integrations page.
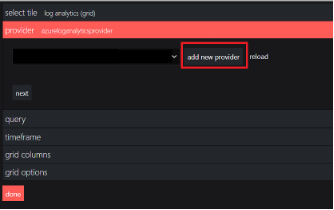
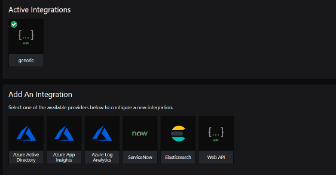
Follow the steps here to configure the provider.
Like I said before, I’m going for the Log Analytics Grid visualization. I have now selected the provider that we have configured.
In the query section I have provided a KQL query to list missing updates for virtual machines:
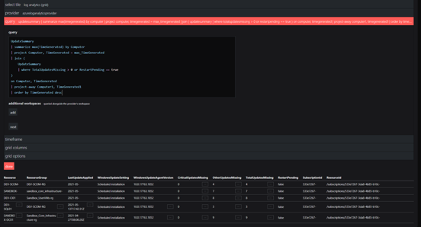
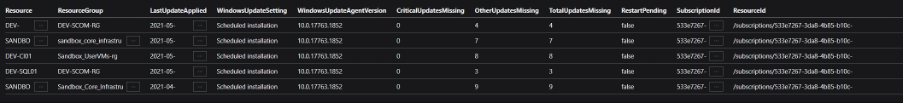
Let's check the results for the last 30 days. Now that I have set the time range to the last 30 days – we’re done!
There are other visualizations like donut, bar etc. that are interesting too – be sure to try them out!
Now let's move on to the App Insights tile and see what we can do.
This would require a new provider to be configured. The provider configuration process for App Insights is largely the same as the one for Log Analytics, the only thing that is different is the application ID. Follow this article to configure the provider for Application Insights.
Let’s go for a Grid tile here as well.
I have selected the provider that I just configured.
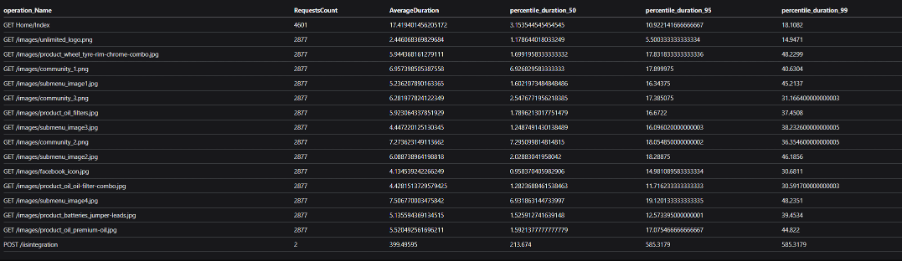
Here I give a KQL query that calculates the request count and duration by operations.
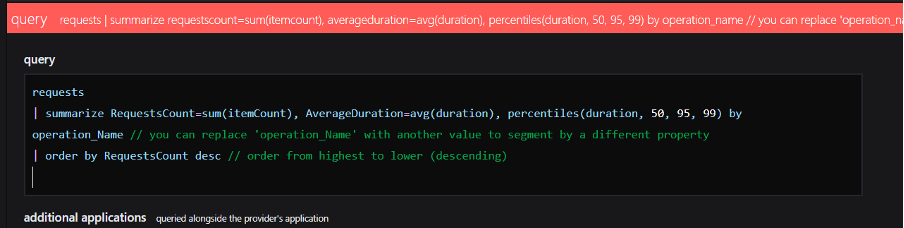
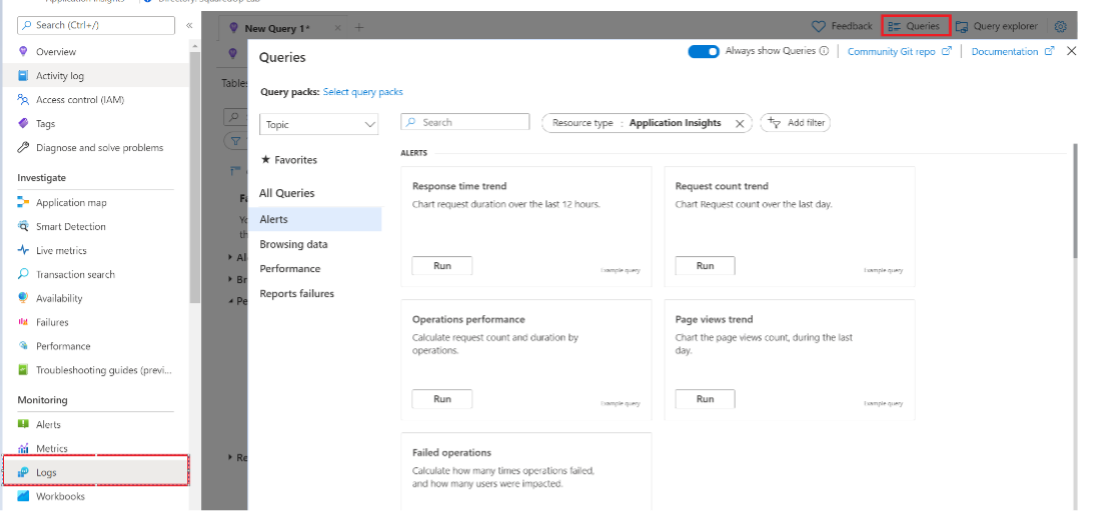
I picked this query from the sample queries you can find in the Logs section of the App Insights resource. You can find several sample queries here to start from.
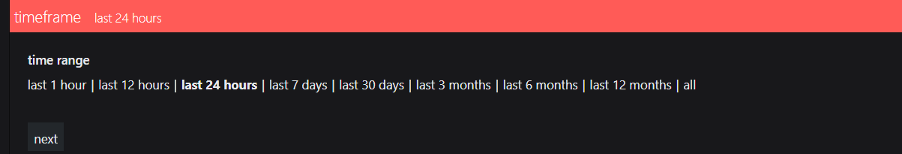
I will set the time frame to be the last 24 hours. Please be careful with extending the timeframe beyond 7 days, as this may pull many thousands of log entries and significantly impact browser performance.
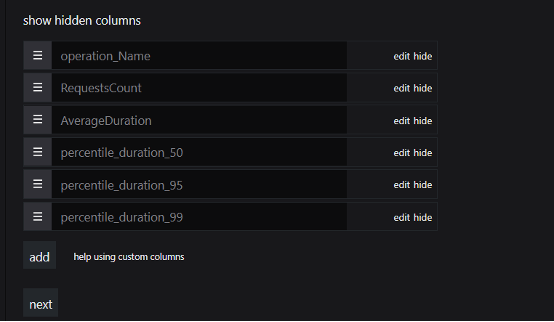
From the Grid columns section, hide or show the columns that you would like to see. A best practice would be to modify the App Insights query to only return those columns (via project or project away) that you would want to see. This will improve performance when loading and displaying the tile.
Here is the final output:
And that’s it! That’s all I've got for you on the Azure tile – we'll move on to the Web Content and Image tiles in the next part.
Happy dashboarding!