
Community Edition: Working with the WebAPI tile

Now that we’ve familiarized ourselves with the basics of SquaredUp Community Edition, let’s get on creating our first dashboard!
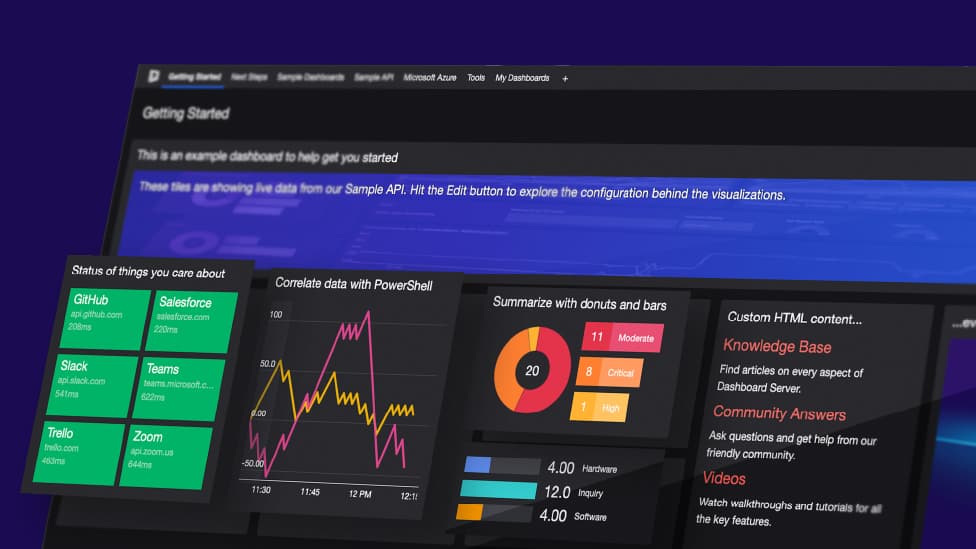
I spot a familiar tile here, the WebAPI tile. This tile is available in the SquaredUp SCOM and Azure products too.
The WebAPI tile is the way you bring external data into SquaredUp. As long as the tool you’re connecting to has an API endpoint that returns data in JSON payload, you can work with that data to display the data in a dashboard in SquaredUp.
There are also a number of visualizations that let you display the data the way it works the best. Here are all the visualizations options that Community Edition provides:
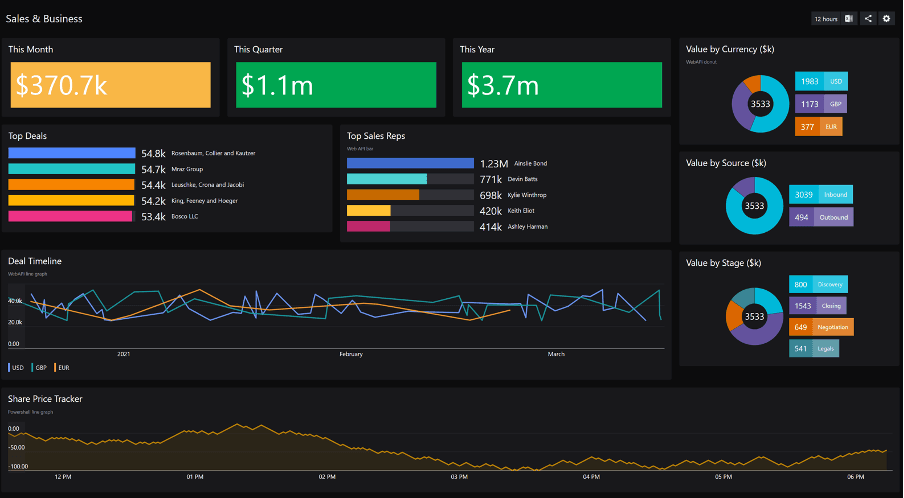
So how does this look on a fully functional dashboard, you ask? Here’s an example:

Pretty neat, eh?
Configuring these tiles is equally easy too. If you’re entirely new to this, and working with a fresh Community Edition install, simply look around and explore the out-of-the-box dashboards. You have all kinds of different samples in there, that should help you understand how that works.
Depending on the type of API you’re working with, you may have to first configure an “integration” – quite simply, this is where you’ll authenticate with your API URL. If the API requires basic auth, or an OAuth2 authentication method, you can configure that here. This is just a one-time configuration that needs to be done for a particular URL (most commonly the base URL), and you should be able to simply pick it from a drop-down list in your tiles, and add an endpoint URL to it if required.
SquaredUp have a step-by-step procedure available here for all the tiles that should get you started. I also wrote a “WebAPI Tips & Tricks” blog that should be of help to extract the data from the JSON payload you receive from your API.
Alright, that’s it for now, let’s take a new tile next time, the one I’m especially excited about. The Powershell tile!
Until then, happy dashboarding!