
Sameer Mhaisekar
SquaredUp, Technical Evangelist
I’ll come clean and admit it – this part of the Community Edition Learning Path series will be a bit interesting given the fact that I know very little about Elasticsearch. So really, this is an honest test of the question – “Can I still build something good with Community Edition even if I only have nominal knowledge of the tool where the data is sourced from?”
Here’s what I know about Elasticsearch – and it may not be very technically accurate. It’s part of the ELK stack (Elastic and Kibana), it is like a log analytics (or a log search) tool that connects to a multitude of data sources and structures, and it stores that data in a JSON-like format that can be searched in a matter of seconds. You can also apply filters on it, query the logs using their query language and even make nice dashboards with it using Kibana.
I can virtually see some of you ELK experts cringing at the description above, but as I mentioned earlier this is how I personally understand it. I haven’t worked with it much before and only know the very basic concepts.
So can I still build a dashboard for something I barely know about? Let’s find out!
To start, I have this Kibana demo instance set up.
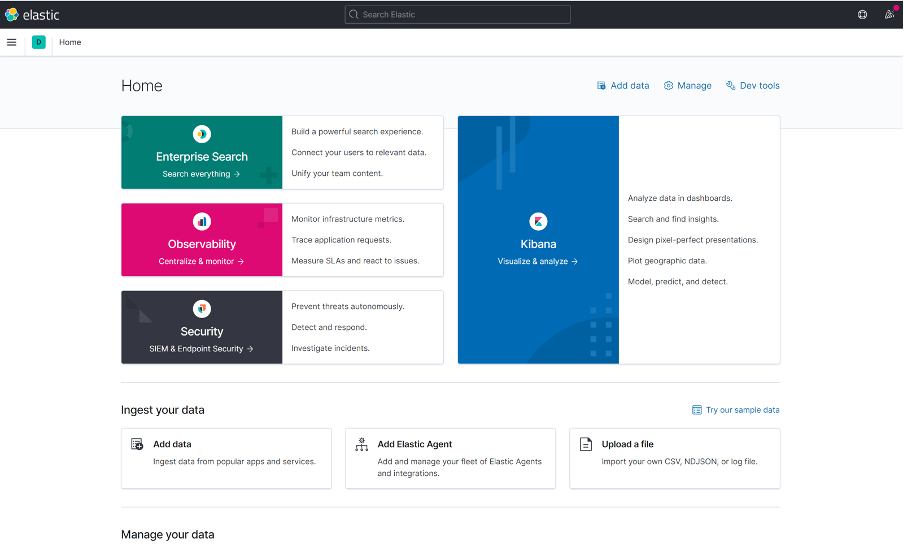
At the moment, this is a vanilla instance and I haven’t connected any data sources to it. So let’s go ahead and do that now.
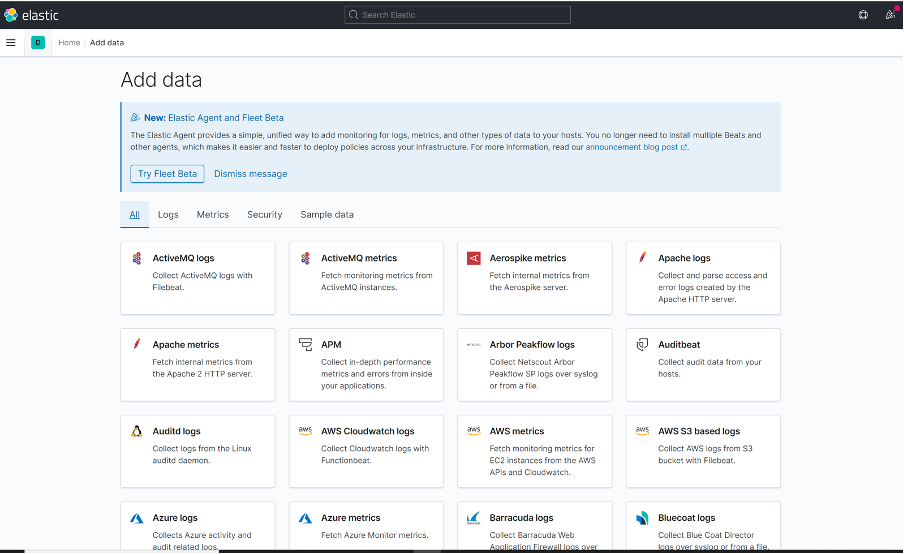
As you can see, you can connect data from practically anywhere, including Azure logs, AWS, Splunk, Docker, Kubernetes – anything.
However, what I am going to do for now is skip the actual connecting of the sources and streaming data, and simply import the sample data. For all intents and purposes, it is like any “real” data for us.
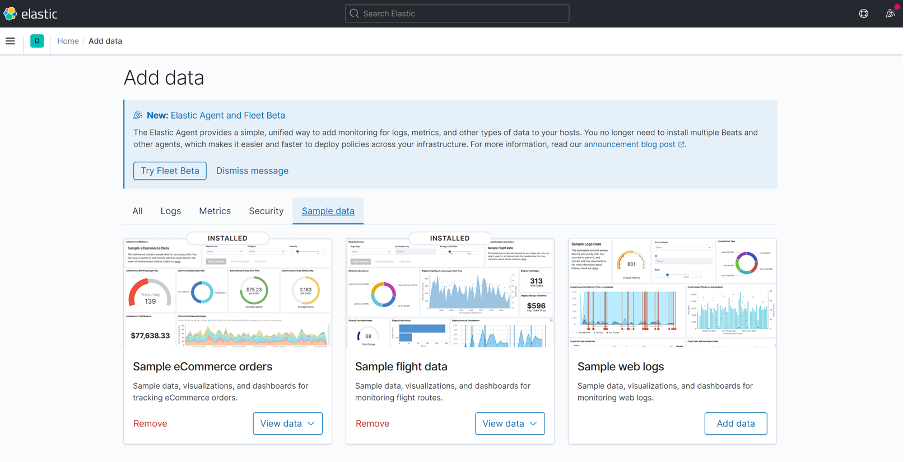
So I’ve gone ahead and imported the “Sample eCommerce orders” and “Sample flight data” data sources in my instance.
As I head over to Kibana > Discover, I see this data present.
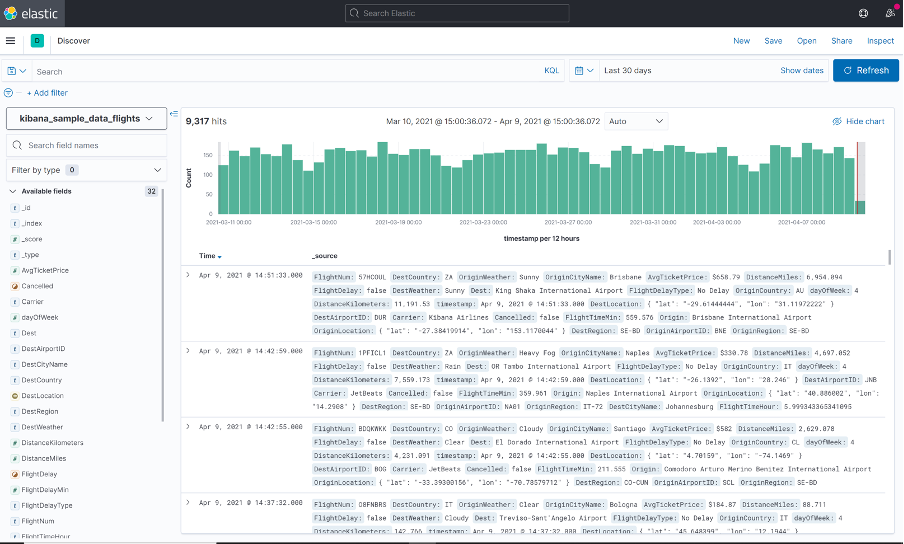
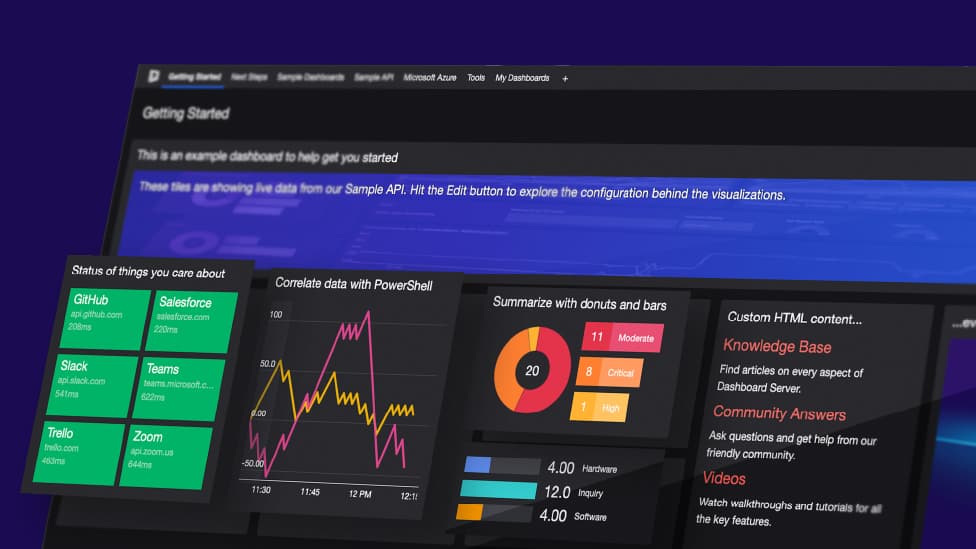
Alright! I now have some data in Elastic, so let's go ahead and display that using SquaredUp.
We'll go to SquaredUp > create new dashboard > add new tile > Elasticsearch.
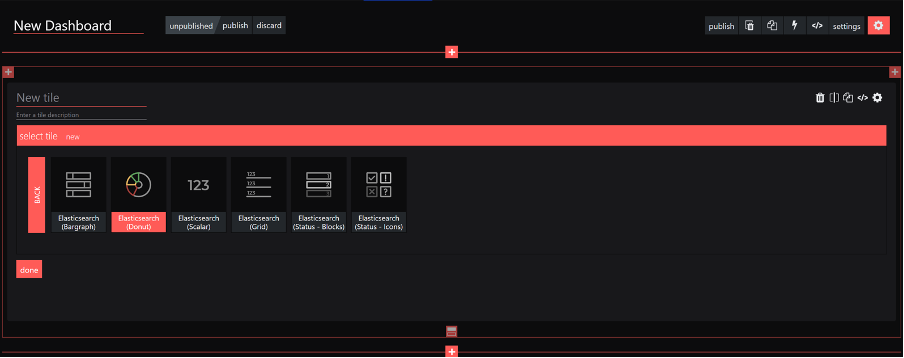
Let’s start with a simple grid tile.
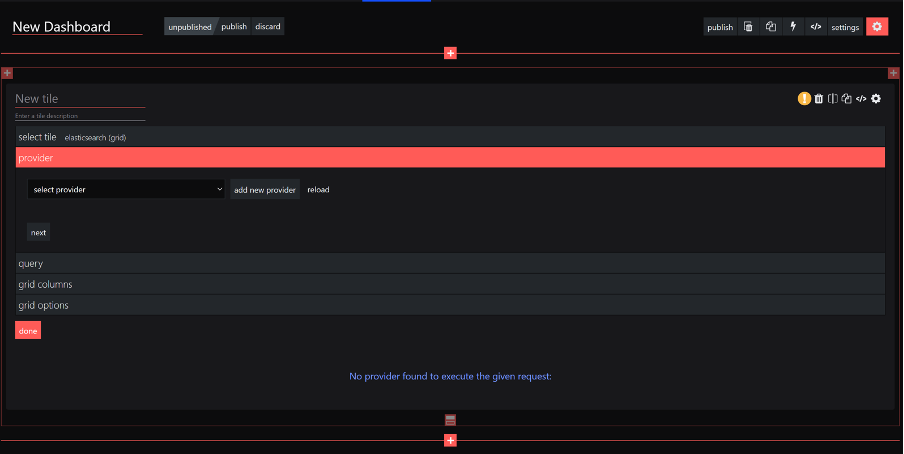
Looks like I have to create the provider first. Let’s quickly do that.
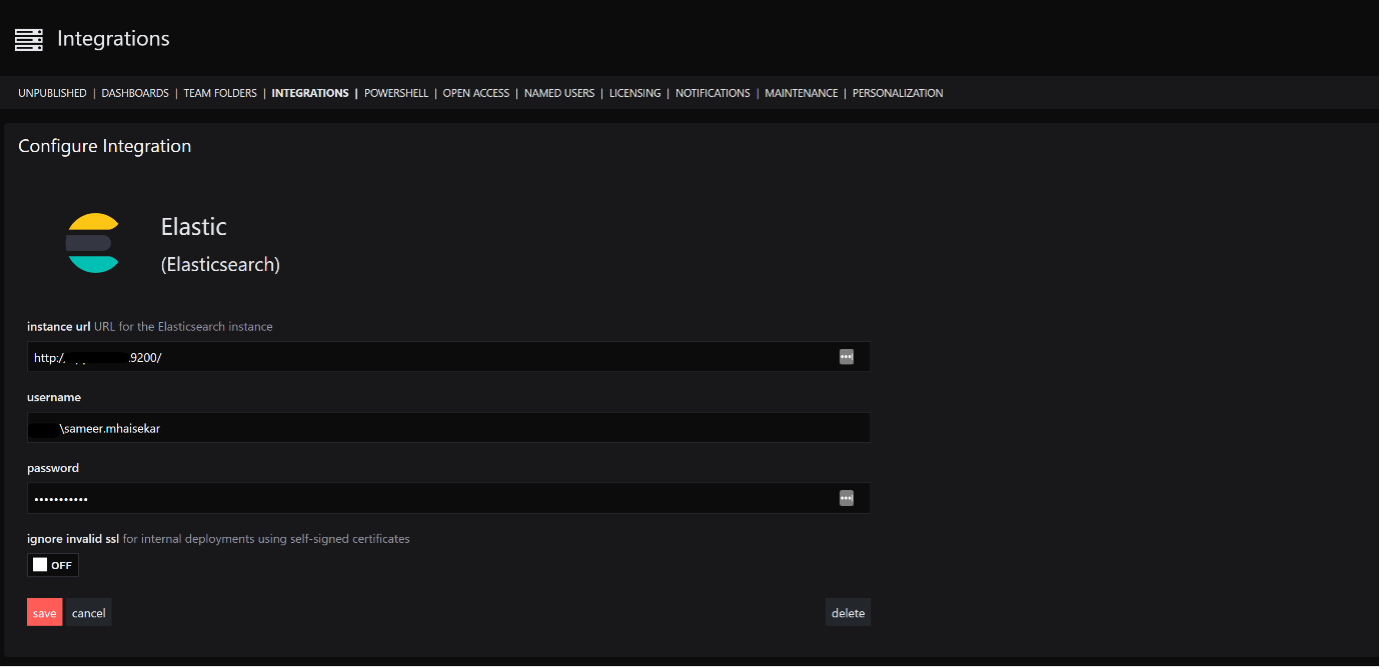
Head over to the hamburger menu on the top right and click system > Integrations > add an Elasticsearch integration.
This is what it should look like:
Alright, with that done, let’s head back over to the Elasticsearch tile and choose the provider that we just created.
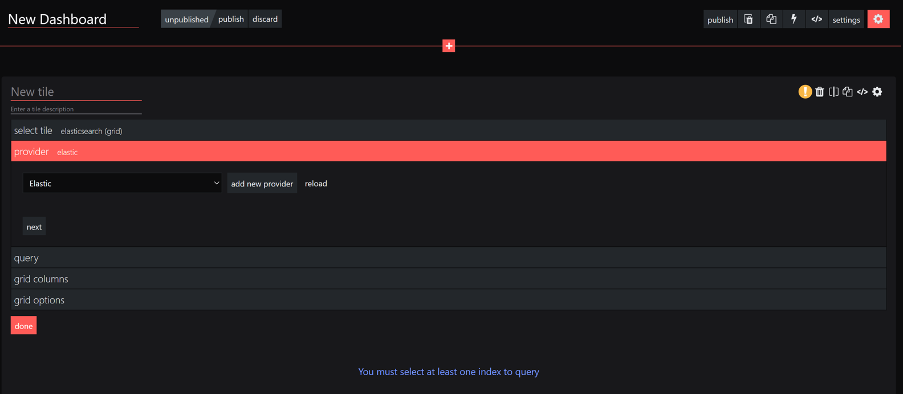
Next up, it’s asking us for the data index and the query to use to retrieve the data.
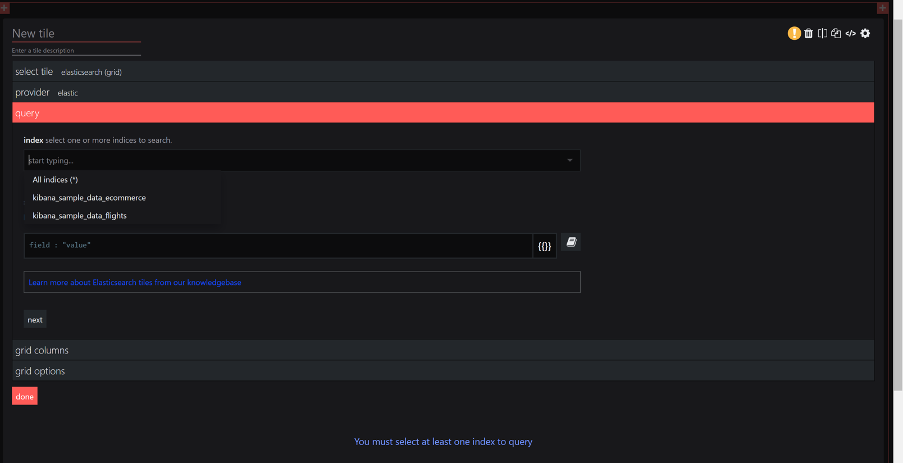
The great thing about this is that it actually fetches all the indices as I click on the box, and you can actually select more than one index too (with support to wildcards)!
Let’s go with the kibana_sample_data_flights sample data that we just imported earlier.
You can also use either Lucene query or DSL. What I have with me is a query DSL that simply lists out the flight log.
{
  "version": true,
  "size": 500,
  "sort": [
    {
      "timestamp": {
        "order": "desc",
        "unmapped_type": "boolean"
      }
    }
  ],
  "fields": [
    {
      "field": "timestamp",
      "format": "date_time"
    }
  ],
  "script_fields": {
    "hour_of_day": {
      "script": {
        "source": "doc['timestamp'].value.hourOfDay",
        "lang": "painless"
      }
    }
  },
  "stored_fields": [
    "*"
  ],
  "_source": {
    "excludes": []
  },
  "query": {
    "bool": {
      "must": [],
      "filter": [
        {
          "match_all": {}
        },
        {
          "match_all": {}
        },
        {
          "range": {
            "timestamp": {
              "gte": "2021-04-08T09:40:57.586Z",
              "lte": "2021-04-09T09:40:57.586Z",
              "format": "strict_date_optional_time"
            }
          }
        }
      ],
      "should": [],
      "must_not": []
    }
  },
  "highlight": {
    "pre_tags": [
      "@kibana-highlighted-field@"
    ],
    "post_tags": [
      "@/kibana-highlighted-field@"
    ],
    "fields": {
      "*": {}
    },
    "fragment_size": 2147483647
  }
}
Let’s input this query and see if we get any result.
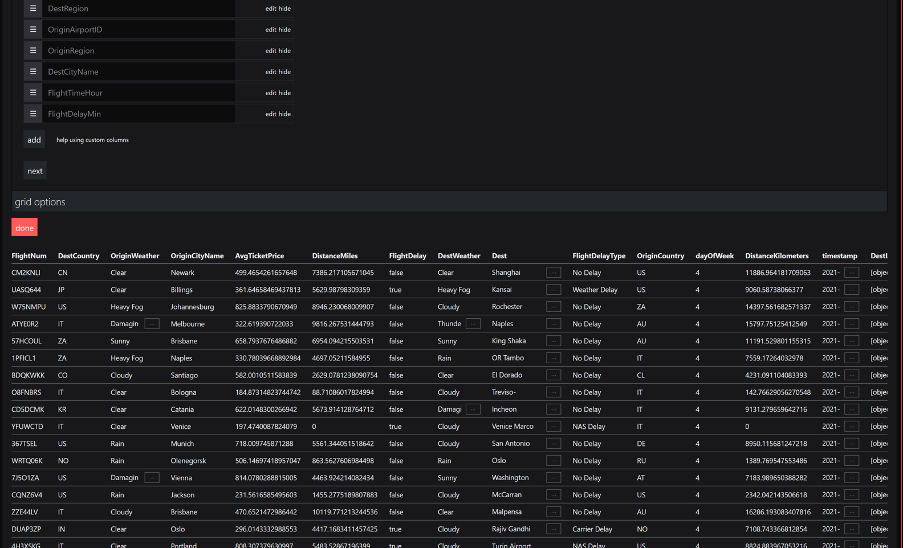
Oh wow, there you go! A grid result already! And I can also choose the columns I want to show and hide. Sweet!
With that foundation, let’s try something fancier. Maybe a donut?
This time I have a query that gives me the weather conditions of the flight origin location.
{
    "version": true,
    "size": 500,
    "sort": [
        {
            "timestamp": {
                "order": "desc",
                "unmapped_type": "boolean"
            }
        }
    ],
    "fields": [
        {
            "field": "timestamp",
            "format": "date_time"
        }
    ],
    "script_fields": {
        "hour_of_day": {
            "script": {
                "source": "doc['timestamp'].value.hourOfDay",
                "lang": "painless"
            }
        }
    },
    "stored_fields": [
        "*"
    ],
    "_source": {
        "excludes": []
    },
    "query": {
        "bool": {
            "must": [],
            "filter": [
                {
                    "match_all": {}
                },
                {
                    "match_all": {}
                },
                {
                    "range": {
                        "timestamp": {
                            "gte": "2021-03-25T09:28:37.424Z",
                            "lte": "2021-03-26T09:28:37.424Z",
                            "format": "strict_date_optional_time"
                        }
                    }
                }
            ],
            "should": [],
            "must_not": []
        }
    },
    "highlight": {
        "pre_tags": [
            "@kibana-highlighted-field@"
        ],
        "post_tags": [
            "@/kibana-highlighted-field@"
        ],
        "fields": {
            "*": {}
        },
        "fragment_size": 2147483647
    }
}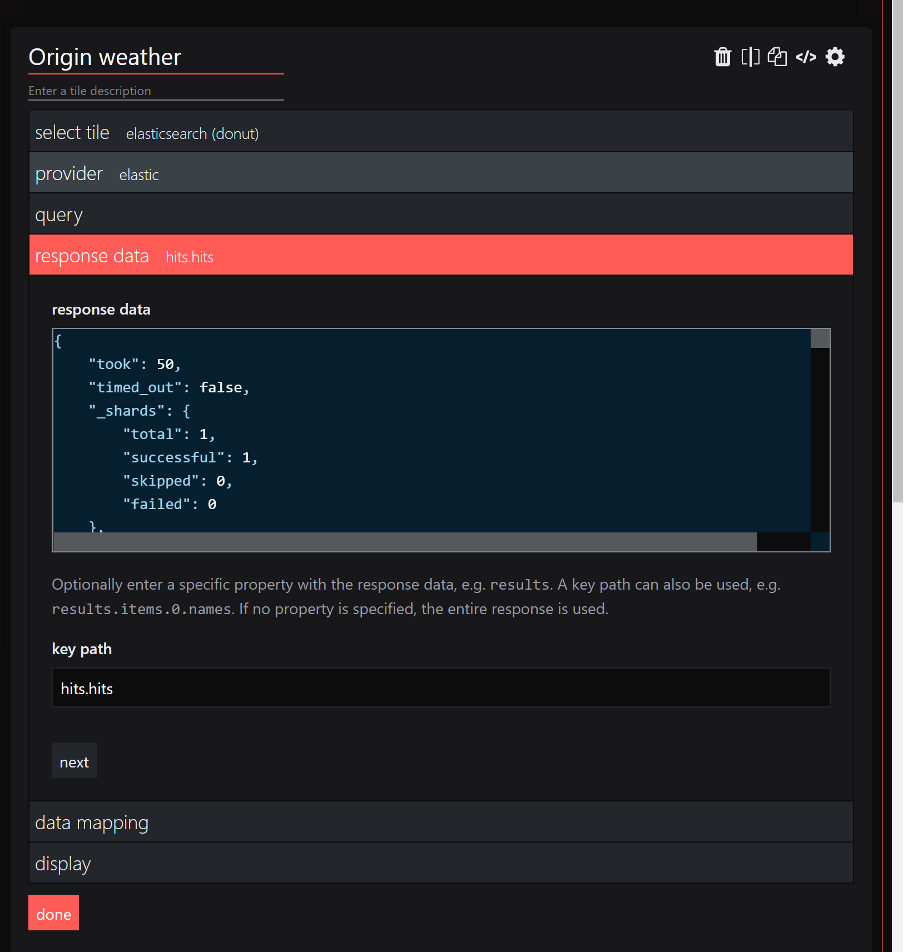
In the donut tile, I notice that I can also see the response that Elastic is returning to me, much like a WebAPI experience. I can also define the key path where the data I’m expecting lies.
Next we do some data mapping, and boom!
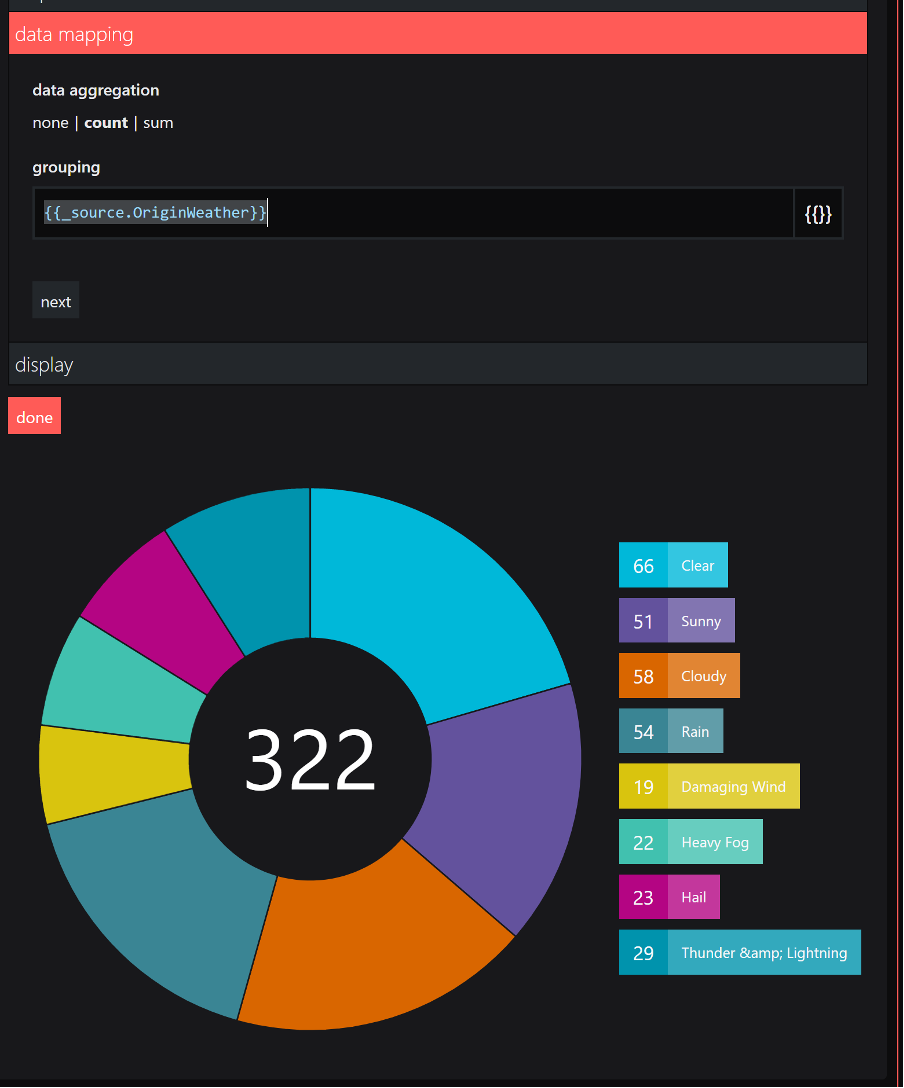
That was actually much easier than I thought. Very straightforward!
Let’s build on that a little and try other visualizations too. And without much effort, I was able to quickly make this dashboard.
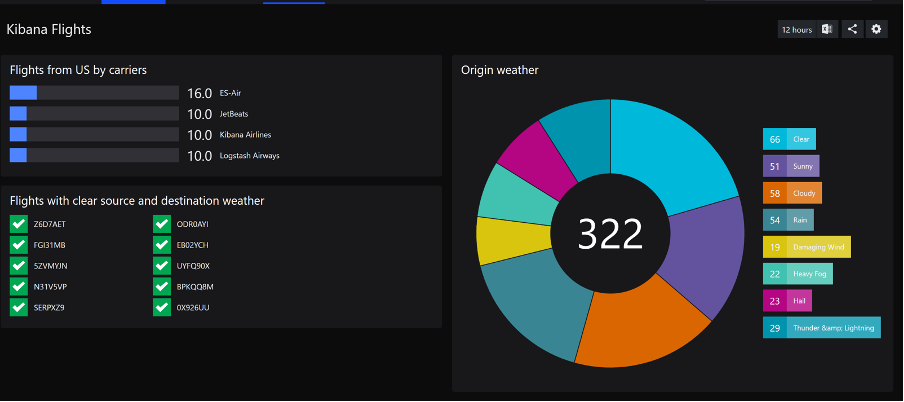
I must say I’m impressed by the simplicity of this. Straight to the point, connect your Elasticsearch instance, choose the index (or indices), enter the query, do some data mapping and voila, dashboard is ready!
After all that, I’m happy to say that the answer to the question, “can someone with little knowledge of the underlying tool still make useful dashboards?” is a definite YES!
Happy dashboarding! ?