Blog

Newsflash: We've got a new Dashboard Server product manager!
We are thrilled to announce that we have hired the SCOM wizard Graham Davies as our new Product Manager for SquaredUp Dashboard Server!

Fixing SCOM's blind spots
Newsflash: it is now possible to extend SCOM to monitor Data Center, Cloud and DevOps spaces too! Read to learn about our latest monitoring solution.
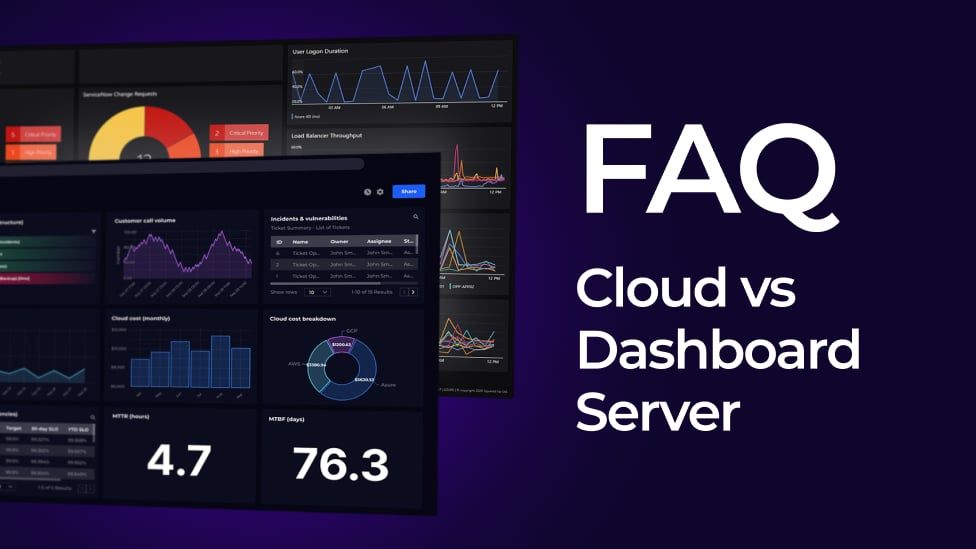
FAQ: SquaredUp Cloud
What is SquaredUp's new SaaS product? And what does this mean for our Dashboard Server solutions? Find out about our latest product launch and future roadmap.
The Big SCOM Survey: Results and expert analysis
Check out the Big SCOM Survey 2021 results in full to understand how we currently view SCOM and what we want to see and do with SCOM in the future.
Latest blogs
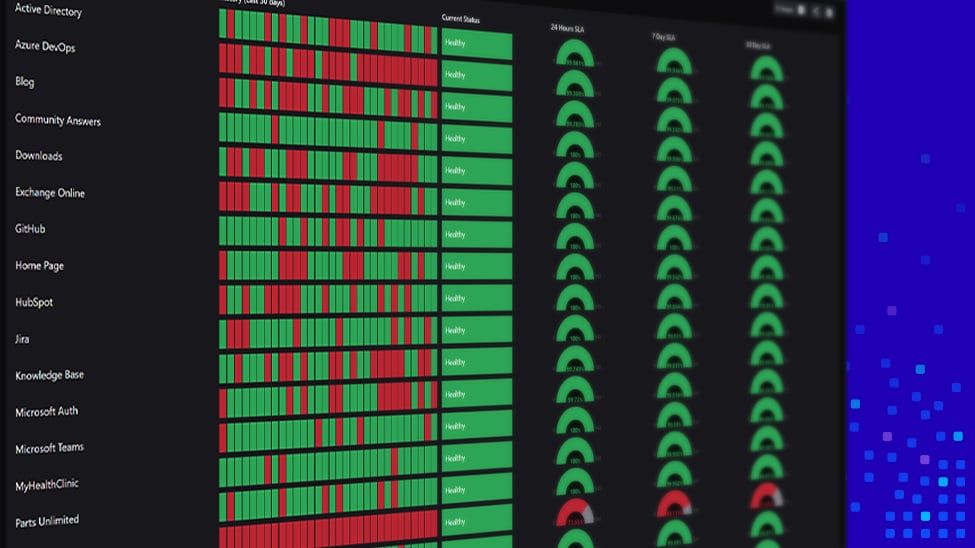
Building powerful tailored SCOM dashboards with Enterprise Applications (Part 2)
How to further tailor SCOM dashboards for different audiences and display only our critical service offerings.

New and improved Community Answers
We are thrilled to announce we've upgraded our much-loved Community Answers platform! Now it's even easier to connect with the monitoring community.

Building powerful tailored SCOM dashboards with Enterprise Applications (Part 1)
Each team has a different need but uses similar data. Learn how to build something flexible that will satisfy all three audiences!

Looking ahead: SquaredUp 5.0 and beyond
SquaredUp Founder & CEO Richard Benwell, shares his outlook for 2021, our current plans for SCOM and Azure, and our future product roadmap.
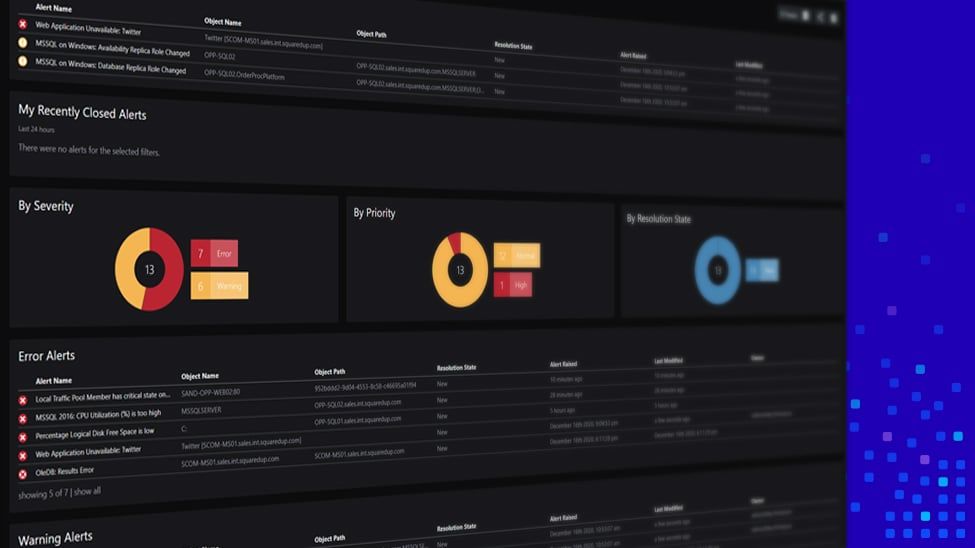
On/Off NOC Dashboards with SquaredUp
Easily create actionable dashboards with personalized task lists for your team or a list of problems to fix - turn your dashboard into an effective to-do list.
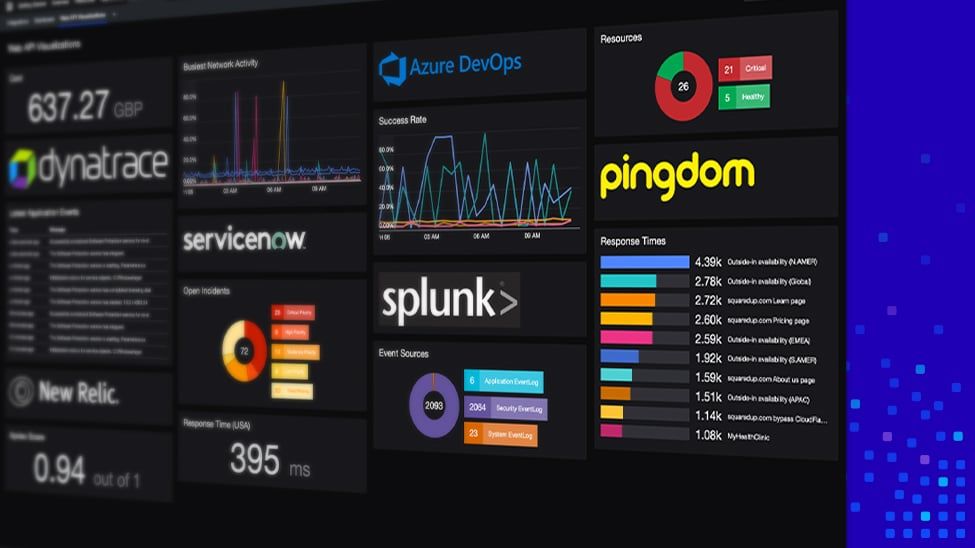
New and improved Web API tile with SquaredUp 5.0
Get data from all your tools in one place, with even more visualizations than before! Including PagerDuty, Splunk, Pingdom, ServiceNow and SolarWinds.
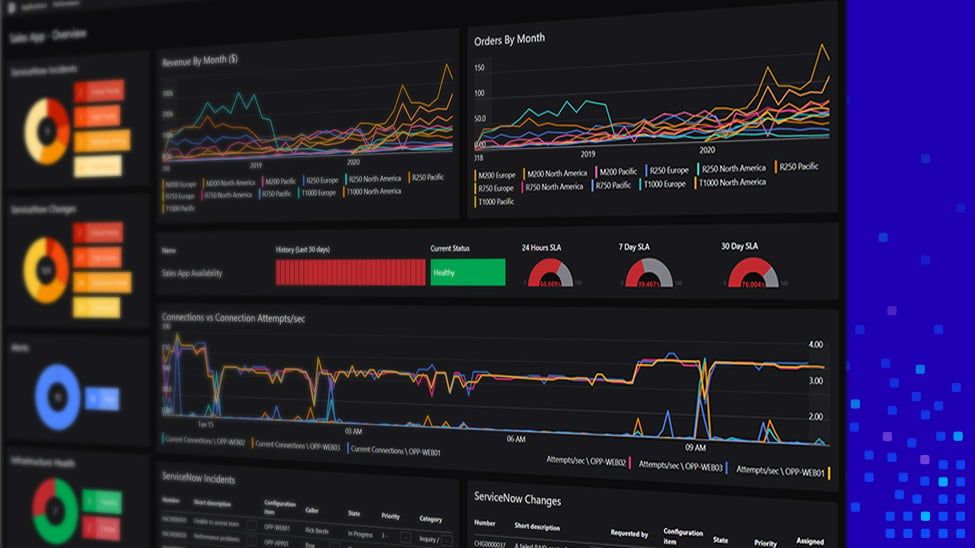
New Open Access with SquaredUp 5.0
The same unlimited shared dashboards for your whole organization – only this time, much more interactive! Deliver an even better service to your stakeholders.
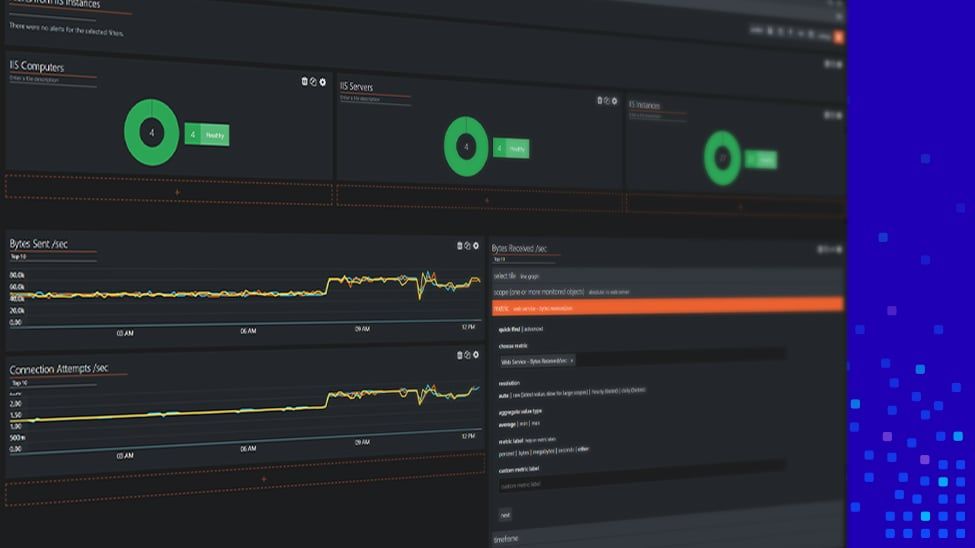
Improved Dashboard Designer experience with SquaredUp 5.0
Get our improved Dashboard Designer experience with SquaredUp 5.0. You can now create the perfect Enterprise IT dashboards with just a few simple clicks.

Community Round-Up: November 2020
Read the latest SquaredUp Community News. Each month we dive into a trending topic to share; what to watch, who to follow, tools to try, and events to join.
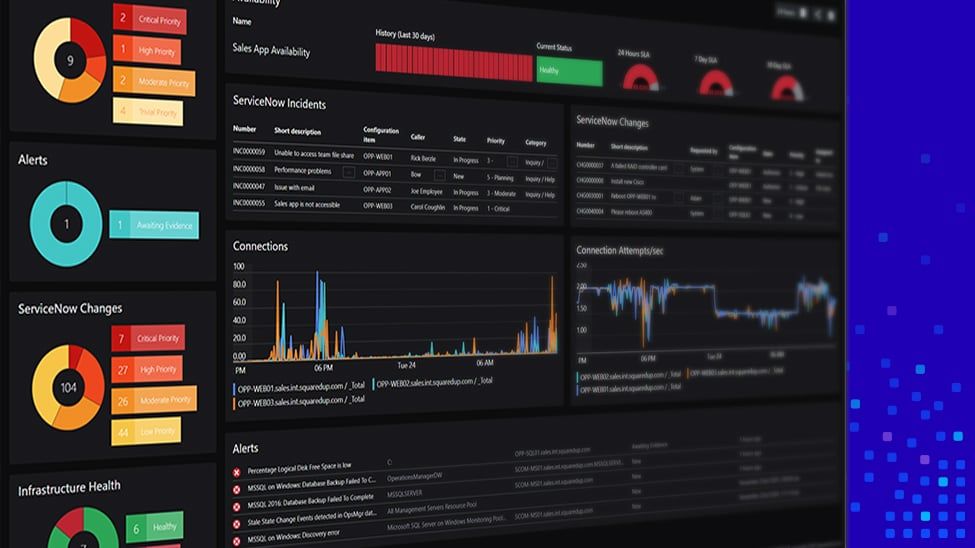
Get the full picture with SquaredUp's ServiceNow Tile (Part 2)
Learn all about how the ServiceNow tile works. We'll explain how the tile works and share some handy tips and tricks to visualize your SNOW ITSM data.
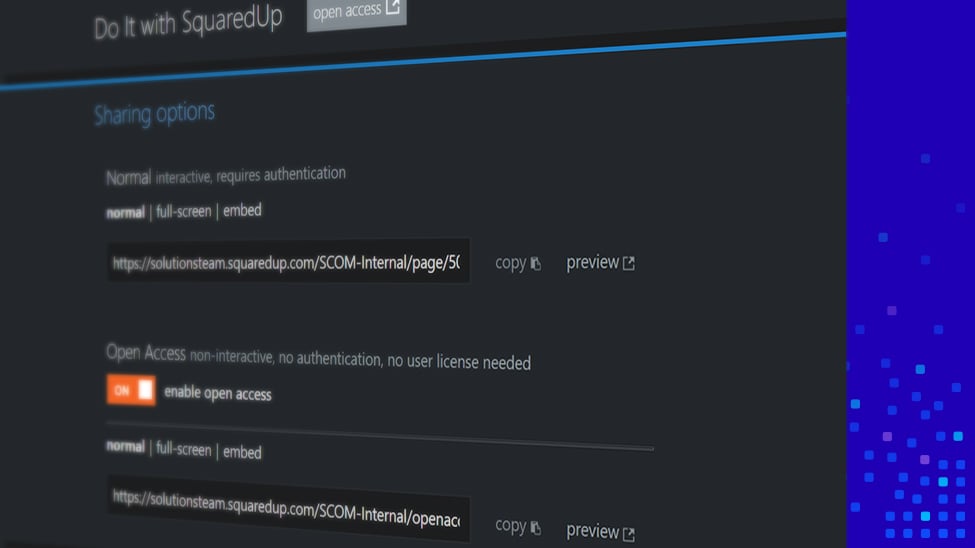
Share dashboards with the business
SquaredUp's Open Access feature allows you to quickly develop a dashboard and easily share it throughout your organization at no additional cost!
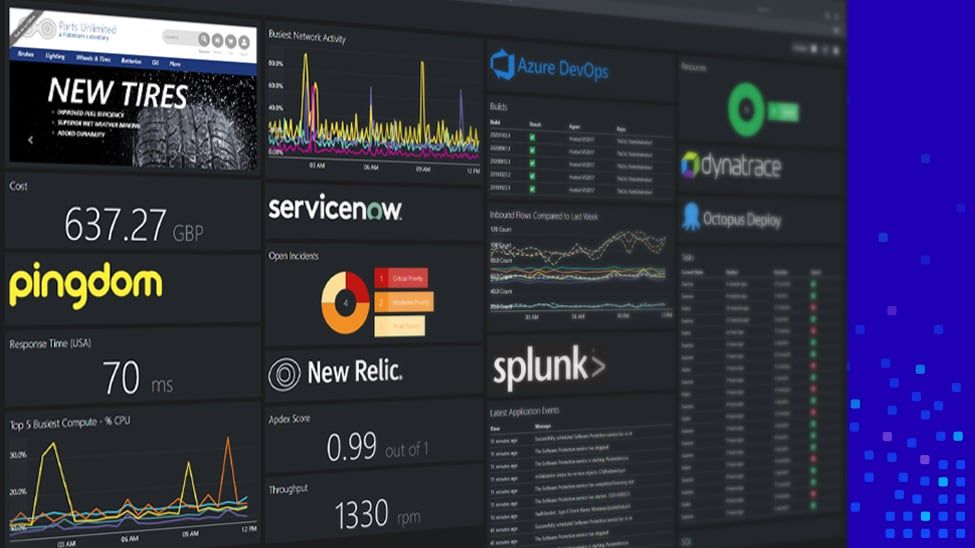
Reduce monitoring silos with SquaredUp WebAPI and SQL tiles
Deliver a singular source of truth to your users from multiple data sources. Get data from Pingdom, New Relic, SQL, SCOM, and more – all on one dashboard.
