Blog

Newsflash: We've got a new Dashboard Server product manager!
We are thrilled to announce that we have hired the SCOM wizard Graham Davies as our new Product Manager for SquaredUp Dashboard Server!

Fixing SCOM's blind spots
Newsflash: it is now possible to extend SCOM to monitor Data Center, Cloud and DevOps spaces too! Read to learn about our latest monitoring solution.
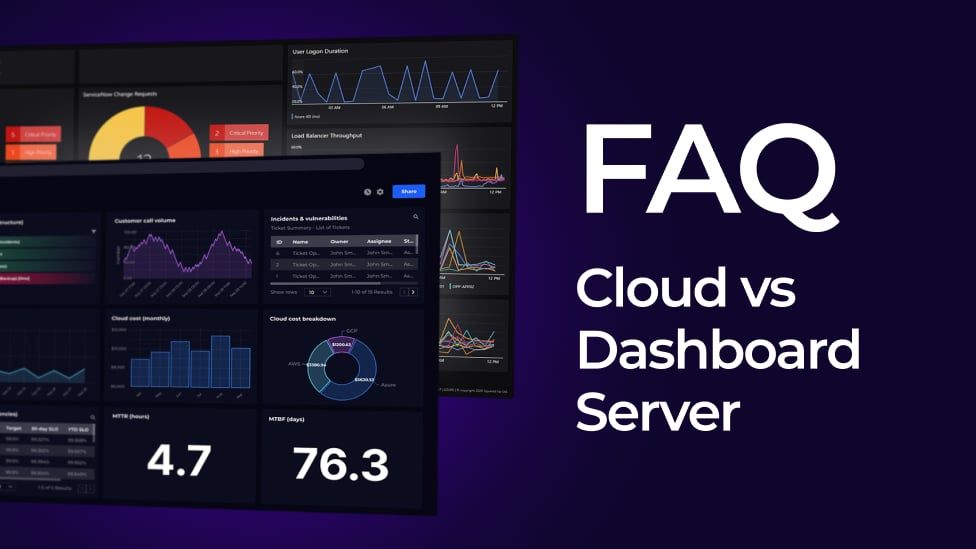
FAQ: SquaredUp Cloud
What is SquaredUp's new SaaS product? And what does this mean for our Dashboard Server solutions? Find out about our latest product launch and future roadmap.

The Big SCOM Survey: Results and expert analysis
Check out the Big SCOM Survey 2021 results in full to understand how we currently view SCOM and what we want to see and do with SCOM in the future.
Latest blogs

SCOMathon 2021 – A big thank you
Thank you SCOM community for making SCOMathon a big success! Read on for the event highlights and session recordings.

Community Round-Up: May 2021
Read the latest SquaredUp Community News. Each month we dive into a trending topic to share; what to watch, who to follow, tools to try, and events to join.
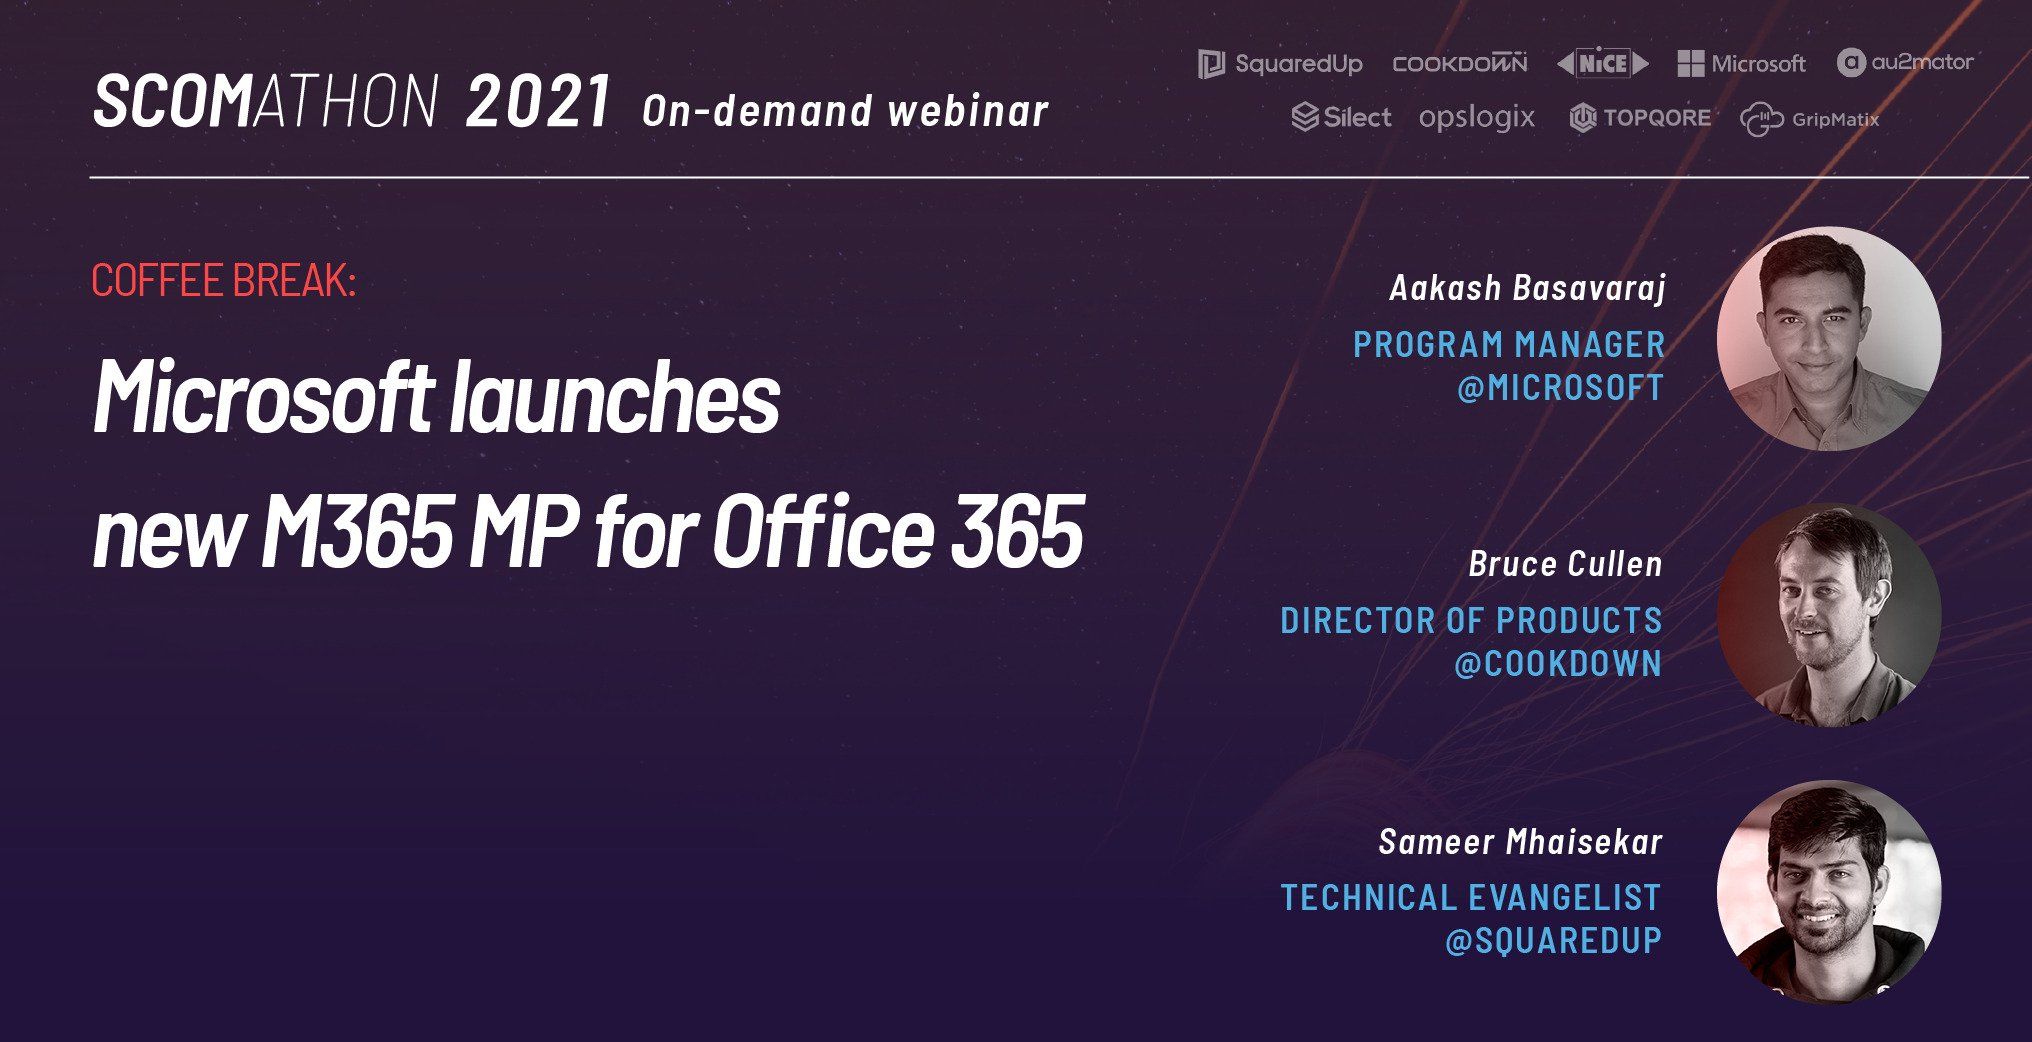
New Microsoft M365 Management Pack for SCOM
Microsoft have launched the new M365 management pack! See a walkthrough of the M365 MP and SquaredUp's powerful dashboards to match.
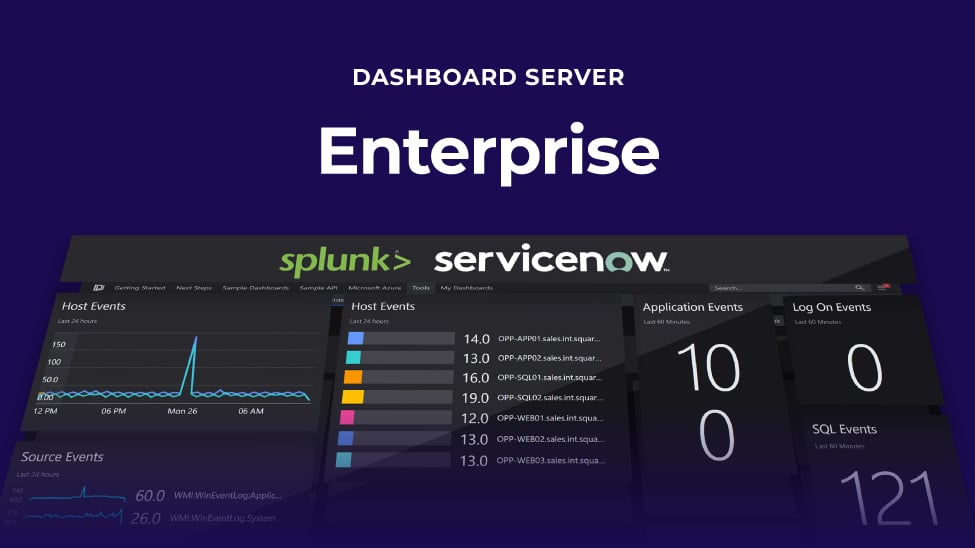
New: Dashboard Server Enterprise version
Endless data connections plus new, enterprise integrations that let you dashboard just about anything. For enterprise organizations who want to scale up.

Community Round-Up: April 2021
Read the latest SquaredUp Community News. Each month we dive into a trending topic to share; what to watch, who to follow, tools to try, and events to join.

SquaredUp 5.1 is here
You an now extend the picture of your business services and applications with these new integrations and visualizations!

Announcing winner of Dashboard Competition
Check out the awesome dashboards that won an $8,000 Star Wars LEGO Death Star! There are plenty of tips and tricks you can steal to enhance your own dashboards.

The top 10 problems with SCOM and how to fix them fast
SCOM may be powerful, but it’s tricky to unearth the valuable data it holds to get to what really matters. See these easy fixes to SCOM's top 10 problems.
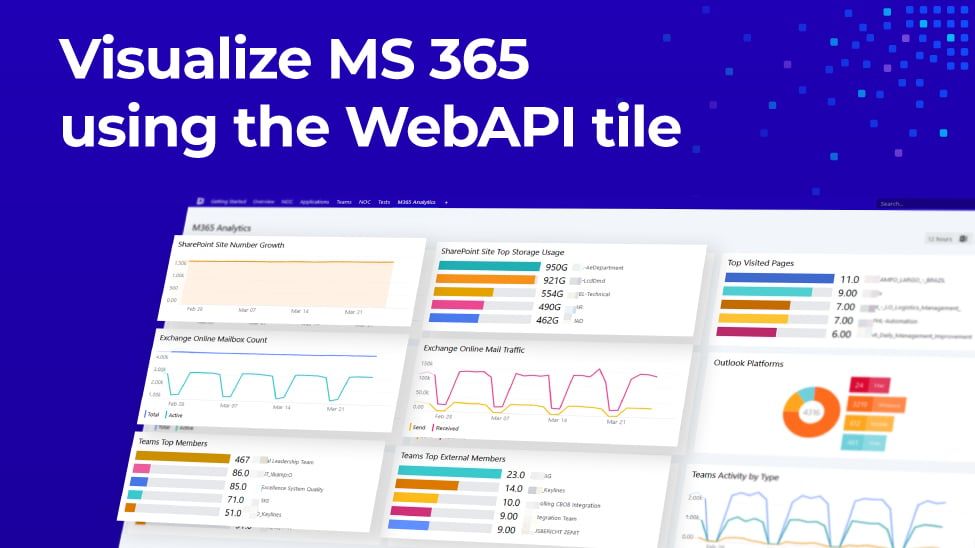
How to build insightful M365 Analytics Dashboards with SquaredUp and Microsoft Graph API (Part 2)
Part 2 of this blog series walks you through exactly how to build insightful M365 Analytics Dashboards with SquaredUp and Microsoft Graph API.

How to build insightful M365 Analytics Dashboards with SquaredUp and Microsoft Graph API (Part 1)
Build M365 Analytics Dashboards with SquaredUp to visualize and manage crucial data from your organization's M365 tenant. Monitor licenses, usage, capacity, and more with ease.

Community Round-Up: March 2021
Read the latest SquaredUp Community News. Each month we dive into a trending topic to share; what to watch, who to follow, tools to try, and events to join.
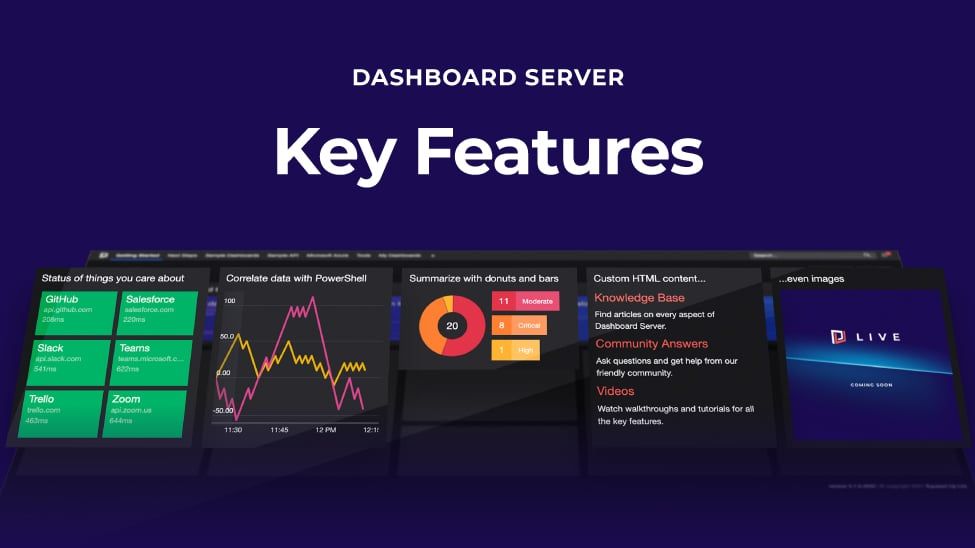
Visualize your DevOps data for free
With this free tool, you can connect to just about any data source you can imagine and build beautiful dashboards in just a few minutes.
