The top 10 problems with SCOM and how to fix them fast
SCOM 2019 is a monitoring powerhouse. Its capabilities are unmatched. But it also has some serious issues when it comes to unearthing and visualizing the valuable data locked inside.
The replacement of Silverlight with HTML5 in the SCOM 2019 web console was a welcome enhancement, but the SCOM web console still shares its design with the administration console, which is slow, complex, and makes it downright difficult to get the visibility you need.
How many times have you asked yourself:
What just happened to cause that alert in SCOM?

SCOM may be powerful, but it’s incredibly difficult to unearth the valuable data it holds to get to what really matters.
And it can’t display all your data. There are business applications and third-party tools that aren’t captured in SCOM monitoring.
That means, through no fault of your own, you struggle to know where to start with fixing errors.
And that increases your MTTR.
Plus, some of the issues that could have been fixed, if only SCOM had shown you where, grow into business problems that affect end users.
Then management gets involved. And everyone continues to curse SCOM and threaten to throw it out of the window and replace it with something “in the cloud”.
If you…
- Lose hours trying to unearth the data you need to fix errors alerted in SCOM…
- Get deluged by a flood of alerts that drown you in noise…
- Are frustrated with not being able to see all your applications in one place…
There’s light at the end of the tunnel.
10 problems, one solution
Your answer lies in a dashboard.
A powerful and beautifully simple dashboard that…
- Gives you visibility of all your third-party data in one place
- Shows you exactly where errors occur and lets you drill down to find the root cause
- Lets you map all your application dependencies so you know what’s affected when
Enter SquaredUp for SCOM.
SquaredUp’s powerful yet simple application dashboards are the missing piece of your monitoring puzzle. They’re actionable.

Fast, easy-to-use, and customizable, SquaredUp not only gets your teams engaged with SCOM, it also enables you to start monitoring your applications with SCOM, not just your infrastructure. It even integrates with third party tools.
Sound good? Read on to find out how SquaredUp can fix your top ten problems with SCOM 2019.
I could list another 10 reasons why SquaredUp makes SCOM a useable product.
Jason Whitaker, Director of IT, South Staffordshire College
Siloed data not visible in SCOM – now all in one place
When your data lives in silos, it’s impossible to keep on top of it all. The SCOM console only shows SCOM data. And if you can’t see your third-party application data in SCOM, you can only see part of the picture at any given time.
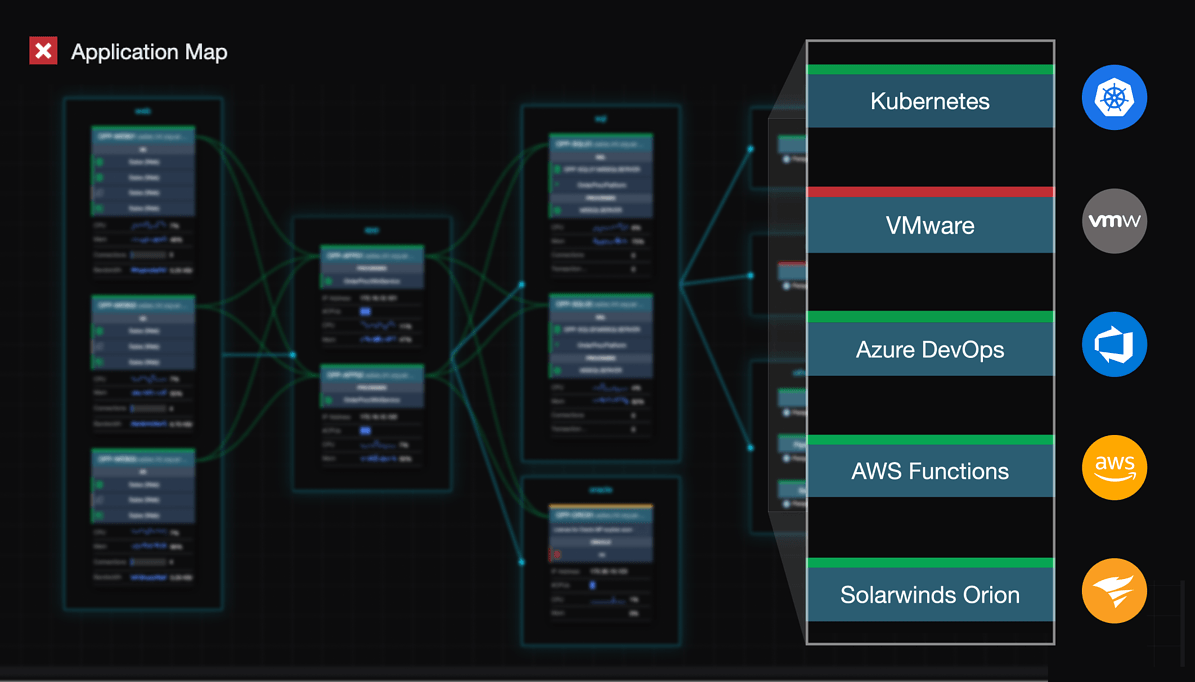
SquaredUp for SCOM can pull in contextual data from both SCOM and other tools, such as Splunk, Service Now, Dynatrace, Pingdom, or basically any other tool that has an API. It’s super easy and fast.
And if your data can’t be accessed via API, there are also PowerShell and Elasticsearch integrations you can use.

Application dependencies are unknown – VADA lets you map them
SCOM doesn’t let you map the dependencies of your many business applications so when errors occur, you can’t always see what was affected or the root cause.
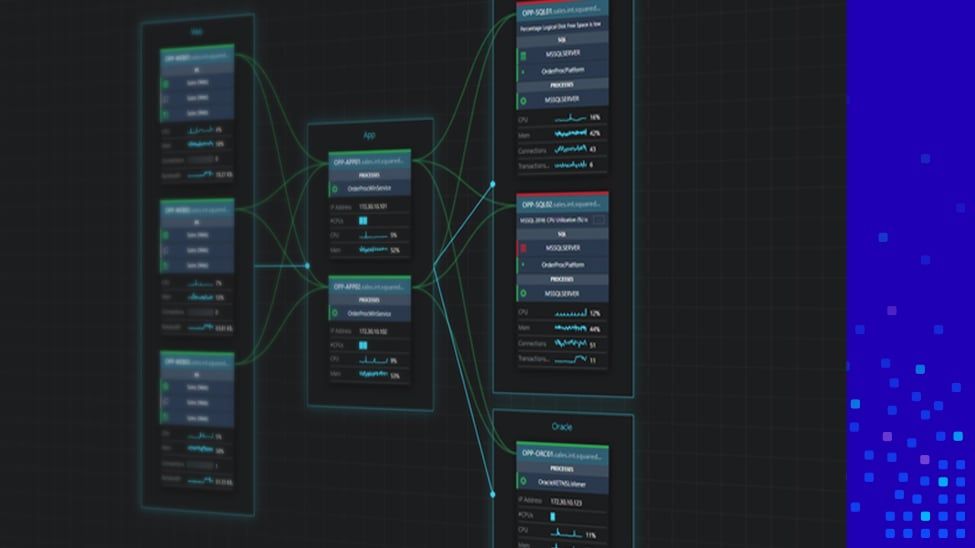
The SquaredUp console lets you automatically discover and map applications so you can see all their dependencies. SquaredUp also gives you the ability to create relevant monitoring around your application right from the SquaredUp console. SCOM web console lacks this capability.

Too much detail at once – drill down and across for fine tuning
SCOM dashboards have no concept of drill across, and “drill down” simply drops you straight into the console’s very detailed monitored object view. It may be great for a SCOM admin wanting to manage the object, but it’s confusing for everyone else.
With SquaredUp users can drill down and drill across (perspectives) to see automatically generated dashboards for objects and groups, so they can explore and investigate easily and find the underlying causes of any issues.
Clunky graphs – dashboard designer for powerful visualizations
Even with the improvements that came in SCOM 2019, the visualizations in SCOM leave a lot to be desired. SCOM gives you pre-built widgets but it is difficult to make your own, and hard or impossible to mix and match. You need to be able to see everything at a glance so you can act fast when something changes.
SquaredUp comes with an intuitive dashboard designer that is easy to use for anyone on your team - not just SCOM admins. And you can build dashboards for any audience, technical or not.
This is how you unlock and prove the power of SCOM to the business.


Un-shareable dashboards – publish with Open Access
Because it’s hard to make SCOM visualizations makes sense to those outside your team, they’re hardly worth sharing. You can put them on SharePoint, but who’s going to look at them? But that’s all different with SquaredUp’s shareable dashboards.
SquaredUp’s Open Access feature makes it easy to share and publish non-interactive, real-time dashboards on the intranet, on wall monitors, or share a link with people without SquaredUp access. No added licenses required.

Rigid templates – Customizable community packs and support
The SCOM web console has rigid templates that cannot be altered once in use. It’s inflexible. Alternatively, you have to start building your dashboards from scratch.
However, SquaredUp has a host of pre-built SquaredUp dashboard packs will get you going in minutes. And they can be customized to suit your needs. And you can always start from scratch. But it will still take you just minutes to get up and running.
Dated – modern Look and Feel
The retro MMC feel of SCOM can be off-putting as a user. The design isn’t intuitive and feels clunky.
SCOM Web Console – Alert Dashboard
SquaredUp looks modern and clean, which encourages more user engagement. Management and technical employees alike love SquaredUp’s dashboards.

SquaredUp – Alert Dashboard
Nobody else cares – unlock dashboards for non-SCOM admins
The SCOM web console is not user-friendly for non-SCOM admins – it’s still very much a console. So nobody else wants to dive into SCOM and you can’t show it’s full potential to others. You need to be able to show other teams the value of SCOM insights.
On the other hand, it’s easy to build and share interactive SquaredUp dashboards that show the metrics that non-monitoring professionals care about – including support teams, app teams, SQL teams etc., and their managers.
Slow – peak performance
SCOM is slow. The smallest change in configuration or time duration in the SCOM web console can take a lot of time to load.
SquaredUp lets you edit your dashboard settings very easily and the data manipulation is surprisingly quick compared to the SCOM web console.
Limited visualizations – more visualizations
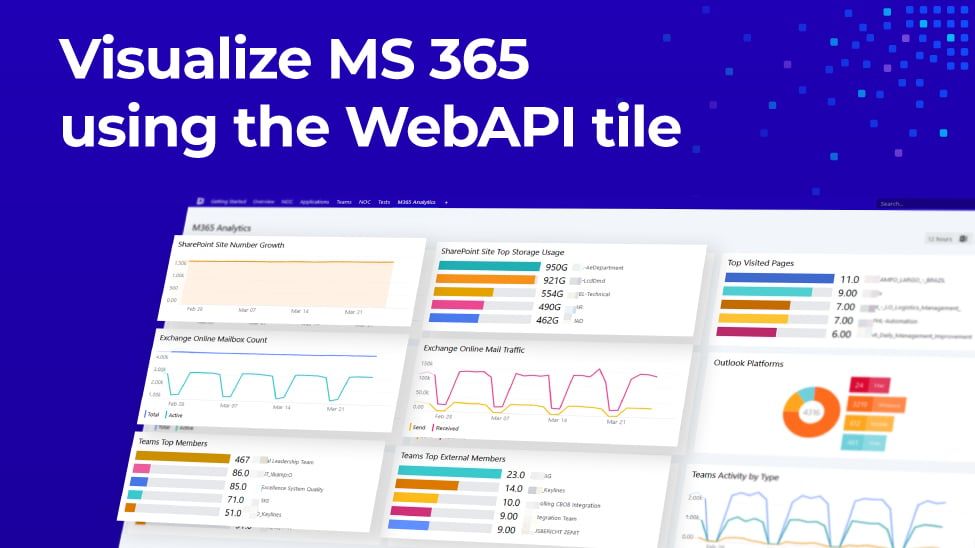
SquaredUp gives you more options for visualizations than the dashboard widgets in SCOM 2019. For example, showing multiple metrics and time comparisons on a single chart, showing spark lines for multiple metrics and objects, matrix tile for summarized views across multiple objects, and more. There are a huge range of visualizations to choose from, like status tiles, line graphs, bar graphs, tables, donut charts, and more in bold colors help everyone understand the health of your infrastructure and applications at a glance.

So, there are our top 10 problems with SCOM and how SquaredUp’s powerfully simple SCOM dashboards can fix them.
Find out more about SquaredUp for SCOM on our website and sign up for a 30-day free trial for unlimited dashboarding.
Happy SCOM dashboarding!
Start your free 30-day trial
Get up and running in minutes and enjoy 30 days of free, unlimited dashboarding!
Further info
- What’s new in SCOM 2019: /guides/whats-new-in-scom-2019/
- What’s new in SCOM 1807: /blog/whats-new-in-scom-1807/
- Webinar: What's new in SCOM 1807: https://www.youtube.com/watch?v=F3hLkiQKNrg
- A handy guide to what’s new in SCOM 1801: /guides/a-handy-guide-to-whats-new-in-scom-1801
- SCOM HTML5 Dashboards: https://www.systemcenterautomation.com/2018/06/scom-html5-dashboards/
- SCOM Webinar playlist: https://duckduckgo.com/?q=squaredup+scom+1801&atb=v125-4__&iax=videos&ia=videos&iai=Nd68ede_OSE