Shawn Williams
Technical Evangelist, SquaredUp


Technical Evangelist, SquaredUp
In my prior three blog posts, we set some ground rules, looked at some out-of-box dashboards, overloaded an in-box property, and finally created an innovative structure to communicate status using SquaredUp's EAM feature.
Looking back, when I started this blog, I explicitly stated that traditional monitoring wasn't our goal. It's essential, but the industry (in broad terms) hasn't been successful with monitoring when the only focus is on the infrastructure perspective. In other words, our goal was to show that the "whole" service is available and how to communicate when it wasn't.
The first three blogs quickly show that when our services are "available," and when they're not, our Internal Operations Center (IOC) can manually toggle a switch to communicate to our stakeholders. Did you pick up on the keyword in that last sentence was that we could do this manually?
Now, you might be asking yourself, why would you create something like this? To put it another way, why should you use SquaredUp for SCOM to make a manual dashboard solution when you could use any other dashboarding tool? The secret is that while the front end is manual, there is a phenomenal Data Warehouse behind the screen that we are slowly leveraging. Since we're layering the monitoring onto our organization, we've created a flexible framework unparalleled in the industry. The biggest problem with an innovative solution is that it is sometimes hard to see the problem solving because it's a gradual change.
With that said, let's peel back the onion a little bit for this post. We will briefly look at Availability Monitoring and the Visual Application Discovery and Analysis (VADA) tools in SquaredUp and how we can layer them into our model. Then we'll briefly talk about using Open Access to share our dashboards broadly.
We left blank in our Enterprise Application (EA) model: Availability Monitoring and the Map groups. Each group is important because they target different audiences. Going back to my first post, we had three different audiences:
Each audience has different requirements, but we can satisfy each of their perspectives with another aspect of our three-part application model. Believe it or not, but when we identified each of the Critical Service Offerings (CSOs) and the Supporting Service Offerings (SSOs), we created what we needed to communicate with our upper management. How?
Well, don't forget that the EAM model also gets a default SLA. That means we can easily report on our up-time. And since this SLA is managed manually, we can (hopefully) trust the results.
Here is a snippet of a screen capture showing the Banner application has been in a critical state for 11 days! (Can you guess who forgot to manually update the health state?)

When we start talking about our End User perspective, we need to put ourselves in our customers' shoes. To put this another way, we need to test our applications to simulate what a customer would do and then automatically alert us if something fails. Likewise, this also means that if everything in our data center falls over, but the customer can still access the web site, who cares how many alerts are raised for the Infrastructure perspective because you're always meeting your SLA.
The difference between reactive versus proactive depends on customer impact. For example, working alerts because the customer is impacted, versus working alerts to keep the application healthy and available.
The first thing we need to do is make our EAs dynamic, in addition to manual intervention. What we need to do now is create some tests that tell us when the customer is impacted. Then, we add these tests to our EA.
Check out the SquaredUp's Knowledge Base article:
Enterprise Applications - How to configure an availability test
For this blog series, we are not going to go into detail about how to create availability tests, but here are a few pointers.
You can have many rules, but each rule should be as simple as possible. And when you implement your rules, if you can use the default availability tests provided by SquaredUp’s EAM to satisfy your requirements, superb! If you already have a rule or monitor in SCOM that can fulfill your need, that's good too. The goal is not to waste time recreating the wheel.
Yes, you heard me. Your team supporting the application should be writing the availability tests. Your monitoring team should not be writing them. When a problem occurs, you call the team that supports the application.
To avoid the finger-pointing, have them write the tests they think will tell them what the problem is. Conversely, that doesn't mean your support team has free reign to create whatever test they want! The monitoring team is responsible for providing the support teams with a framework for the availability tests.
A sample framework could be something like this:
Scripts from other support teams should all look similar to each other. This similarity will help with supporting the tests, and the skills will be transferable between groups.
Everybody wants to know something broke immediately, and they want it fixed immediately. But the reality is that it takes time for someone to get plugged into a problem. My recommendation is that you shouldn't waste your time on the perfect alert/notification system, but you should establish and adhere to a process.
Let me put this another way, you created a script to watch your application, but during the last couple of alerts, you solved the problem by taking the same action. That's great, and your next step should be to automate the fix for that specific problem. And if you adhered to the script framework, you can add it as a remediation step to have SCOM run that automatically for you too.
SCOM collects a lot of information. Now take a deep breath and say that again, except this time with emphasis. SCOM collects A LOT of information, which is precisely the problem and why many organizations have a problem with traditional monitoring tools.
There is so much information that it is sometimes hard to see the value. Now we could stop and discuss tuning or how you should turn off all of your alerts (see the Manifesto for SCOM Success), but the truth is that getting your organization to adopt a new monitoring posture is like pushing against a mountain. Sometimes, it's just better to use what you already have in place, and that's where VADA comes into the picture.
With VADA, we can visually document an application or system using your existing monitoring product, i.e. SCOM. A by-product of VADA is that it also gets a grouping of all alerts for any single application. That means when we create our relationships, and when we look at an EAM dashboard, we will also "see" the dependant alerts, but in the correct context. We also get a fully populated CMDB, but that's a topic for another day.
Be sure to check out SquaredUp's Knowledge Base Article:
Visual Application Discovery and Analysis (VADA)
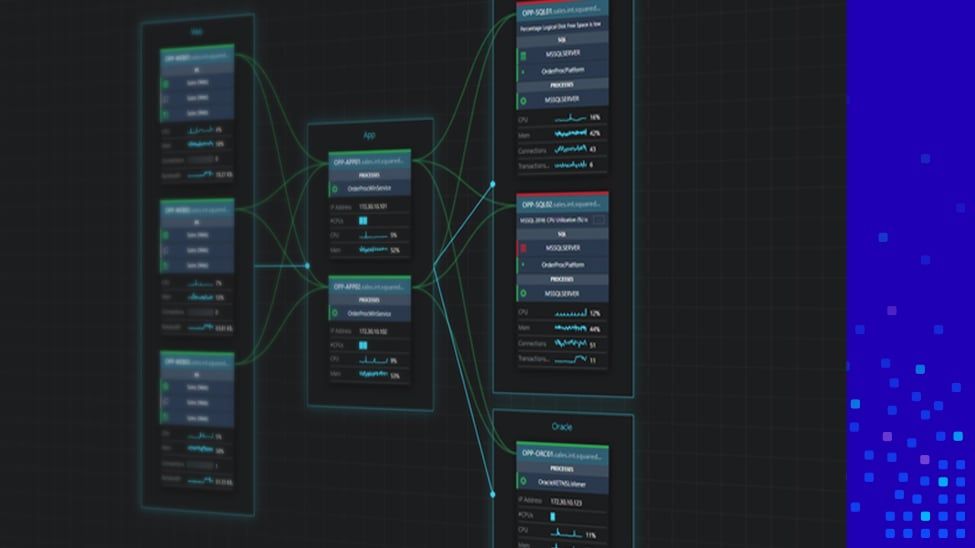
For illustration, we're going to create a fake Banner diagram by adding three servers to our EA. We will then create a dashboard for our Support team showing the VADA diagram, the alerts, and SLA's, all in one place:

As you can see from the dashboard, we can quickly show everything in one place for our support team. At a glance, the support team will be to see the network links between the servers, any recent alerts! Keep the main focus of this dashboard to those items the Support team needs to be successful.
Referring back to our three different audiences, each persona should see something different. In the last section, we saw the Support team dashboard. But that type of dashboard is great if we're assuming that our admins can log into SquaredUp and, by extension, SCOM. But you don't want your management or your customers to log into your monitoring system. That's where Open Access comes into play. We'll create some dashboards that we want to share, but we won't cover how to enable or create Open Access dashboards.
Check out SquaredUp's Open Access Knowledge Base Article: Open Access
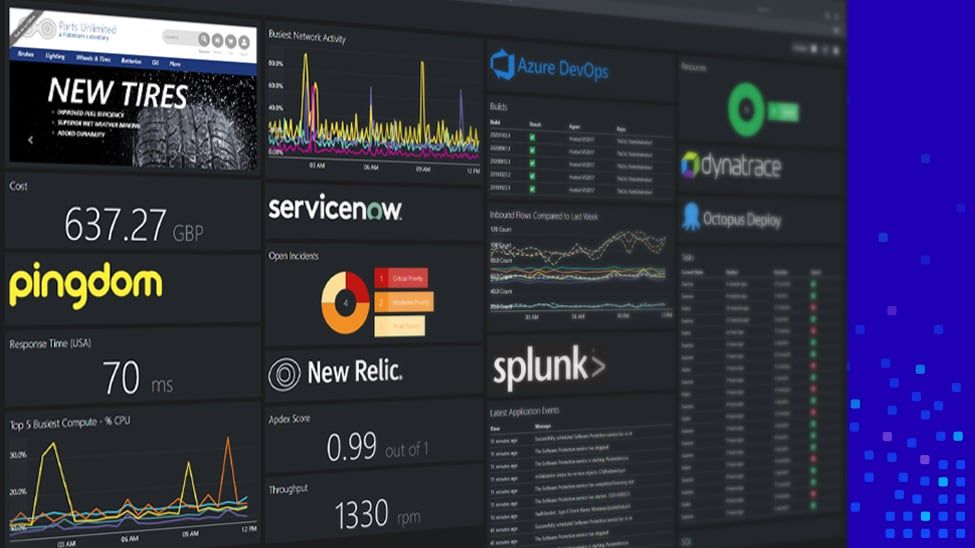
Our Management Level would probably want to look at a high-level dashboard that breaks out the CSOs and SSOs so that, at a glance, they make sure everything is in an operational state. Maybe something like this:

Our end-users should only see the highest level of any application or service, possibly something like this:

Or maybe something like these (screen captures from my Android phone)?


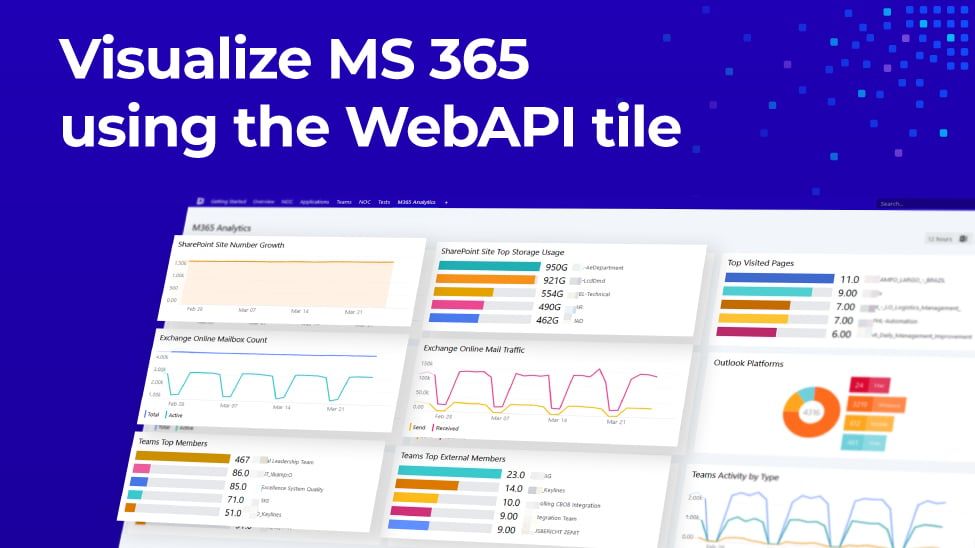
Pro tip: SquaredUp Open Access is a great solution to share dashboards with your users, but sometimes you have a business requirement that mandates a specific presentation layer. In that case, use SCOM's REST API to pull out the data you need and display it consistently with your business requirements.
In the last post, we reviewed the ground rules, created some relationships, and demonstrated how to change the health state of an EA manually. We talked about layering in some availability monitoring and the other aspects of our infrastructure for this post.
While we didn't exactly cover how to layer in availability and infrastructure components, we talked about why it's essential to do it. In fact, availability monitoring and Infrastructure monitoring could each be an entire blog series unto themselves. But for this series, we needed to talk about them to show that we can include those components into a holistic monitoring approach, allowing for automatic and manual communication to a broad range of stakeholders.
Speaking of holistic, behind the EAM model is a CMDB that can be leveraged for even more integration goodness. But that's a blog series for another time.
Till next time!
-Shawn
Technical Evangelist, SquaredUp