Visualize your DevOps data for free
Visualize your DevOps data for free
We recently launched the public preview of a new tool that lets anyone dashboard anything – for free. Meet Dashboard Server!
You can download it free because we wanted to get our incredible dashboards in the hands of more people. The SCOM community know us well but our dashboards are perfect for so many use cases beyond System Center monitoring. And if you love them as much as we think you will, all we ask in return is that you share that love by spreading the word.
Visualize anything
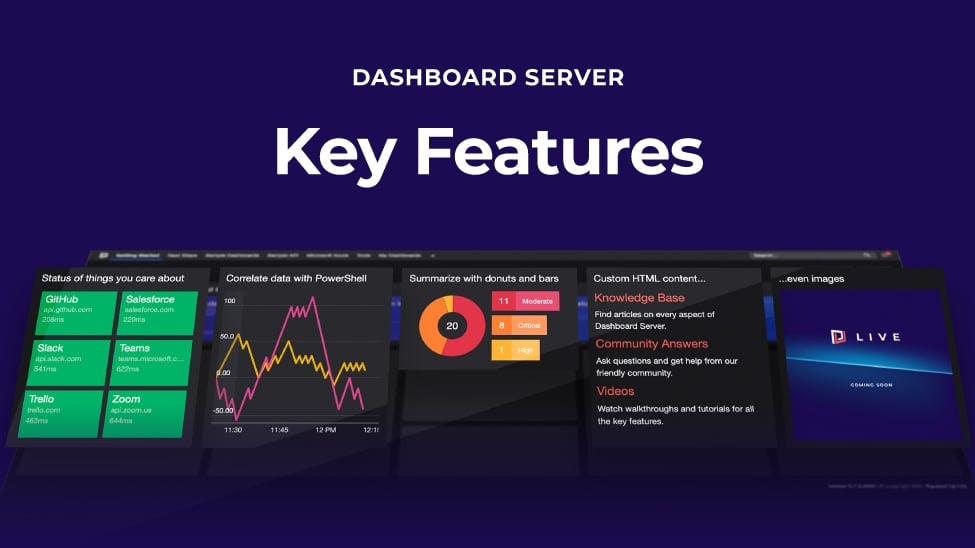
With the free Dashboard Server, you can connect to just about any data source you can imagine and build beautiful dashboards in just a few minutes.
Here are a few of the things you can do with Dashboard Server:
- Visualize any data source using in-built API, SQL, and PowerShell tools
- Build beautiful dashboards in minutes with the intuitive Dashboard Designer
- See your data in real-time for instant insights
- Add your most popular IT tools like Active Directory and Windows Server with native integrations
- Share unlimited dashboards so everyone has visibility
All that lets you build a dashboard for your IT team to monitor application availability, or for your Support Team to monitor the ticket requests, or to show Marketing which of their campaigns are performing best, or to upload Finance’s CSVs so they can visualise the EBITDA… your options are endless.
Danny, Systems Administrator at Purdue UniversityThe SquaredUp Dashboards are beautiful and very easy to organize to show both management and technical employees critical data at a glance.
Get the full run-down of the features and download Dashboard Server for free here:
Take a tour of the possibilities
With incredible SquaredUp dashboards at your fingertips, you can deliver instant insights to your team and beyond with data visualizations that help you monitor everything.
Let’s take an example and work through how you might use SquaredUp Dashboard Server.
A DevOps Manager will want to see all their application metrics in one place. The applications team needs to be able to see the status of every application and spot issues as they occur, at a glance.
Martin Ehrnst, Tech Lead Cloud Platform at VippsWith SquaredUp, I solved both dashboarding and integration challenges with monitoring. Today they have released a stand-alone product with PowerShell support that allows you to dash out anything. It's also free!
Connect to your data
To get started with Dashboard Server, you need to connect to the data available either in your database, perhaps in MySQL or Oracle, or directly to the application. Or you can upload CSV files using the API tile.
Say you want to visualize all the data held in PagerDuty so you can visualize incident response data. You could connect to that database with a PowerShell script. Here’s where you can do that in Dashboard Server.
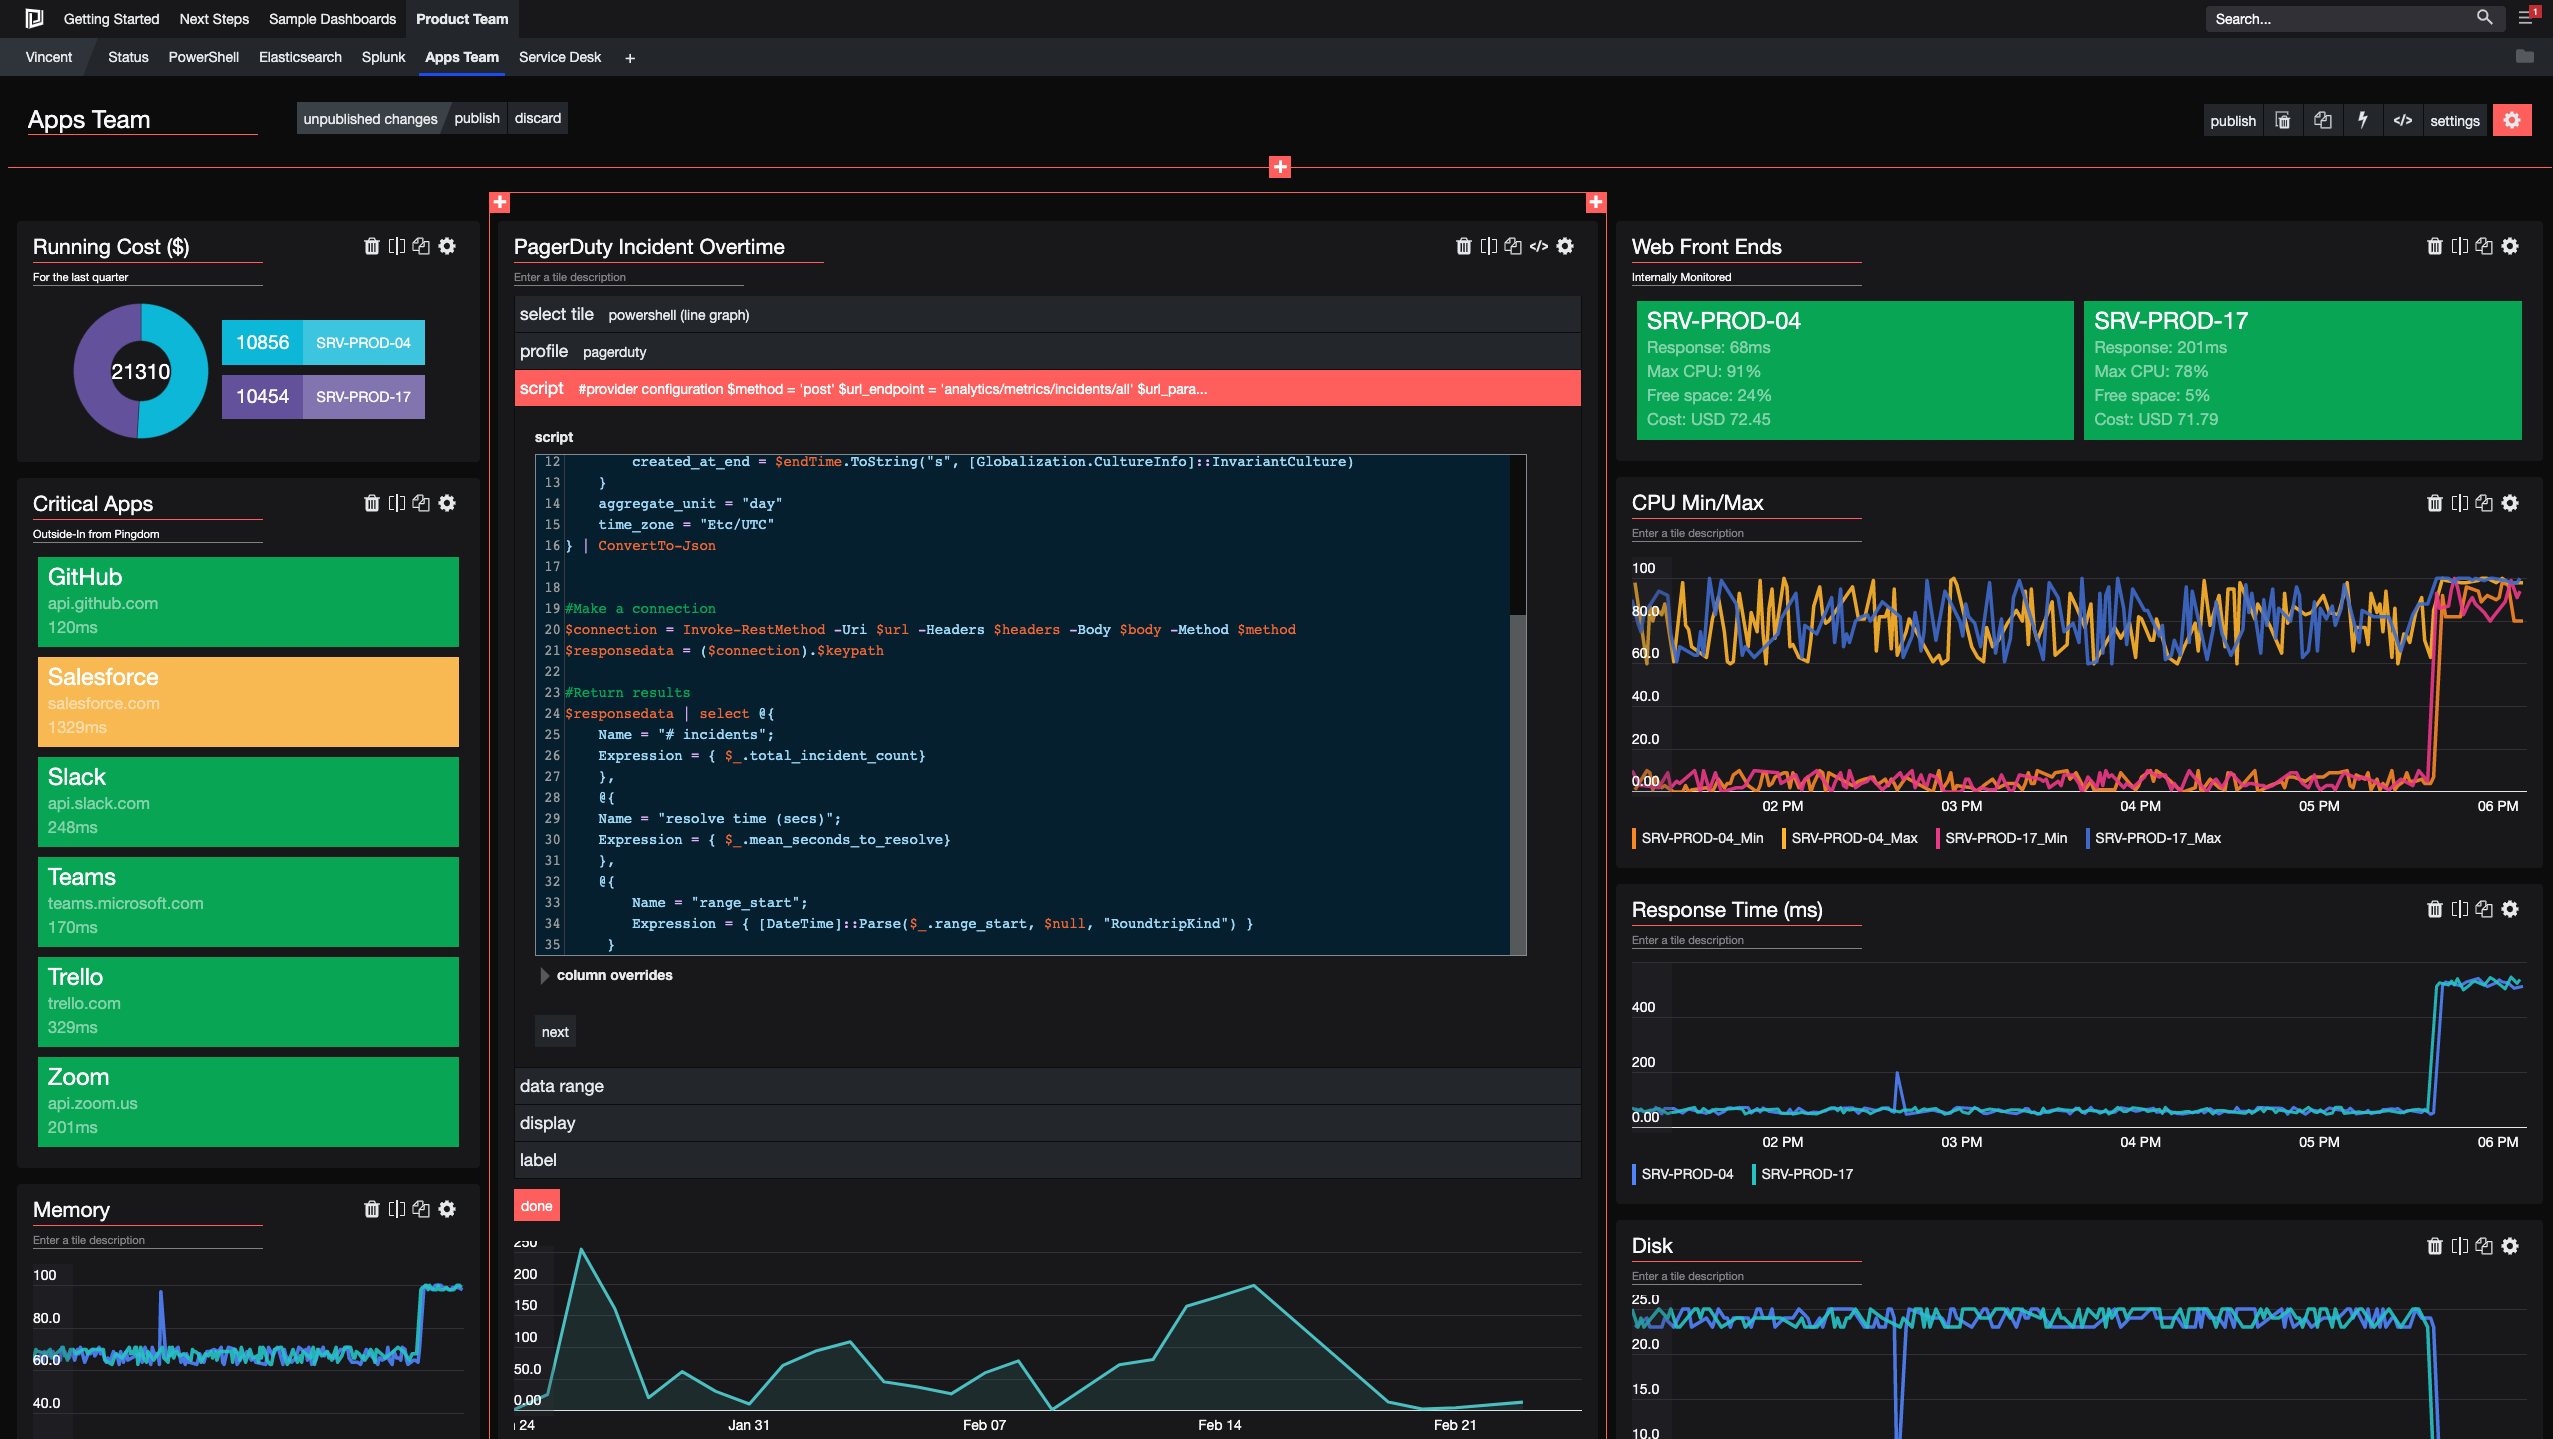
You can even manipulate the data by adding in an ETL process in the script. This gives you almost endless possibilities for powerfully visualising your data how you want to see it. And it’s easily repeatable and adaptable for every new dashboard.
Other ways you can connect to your data source would be via an API or using SQL.
Create your first dashboard
Now you’re connected to your data source, create a dashboard by clicking the + button to use the intuitive Dashboard Designer. You also have the option to use out-of-the-box templates to get you started.
Take a browse through the several example dashboards already set up within Dashboard Server and play with their layouts and look under the hood to see how the data was pulled in and used. Take note of the layouts as well. A dashboard is only useful if it can be understood with minimal effort.
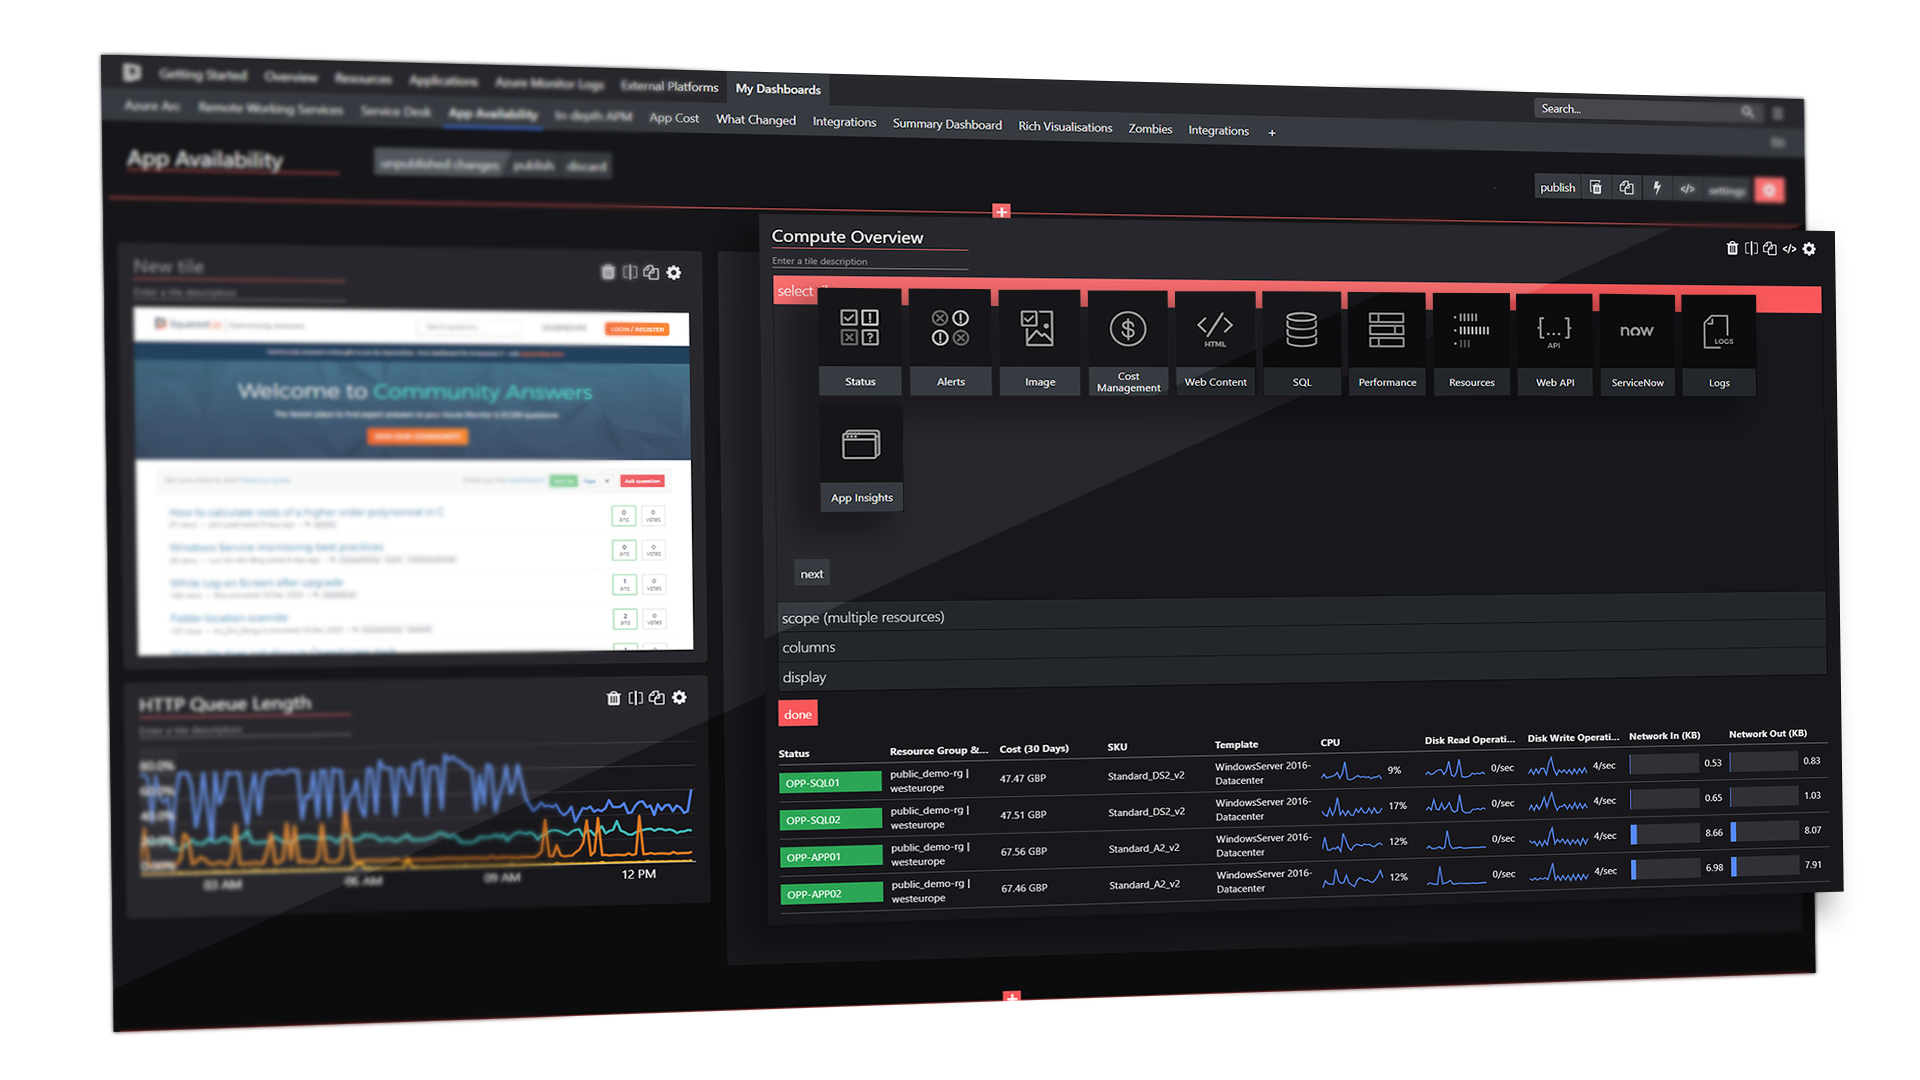
To build your first dashboard report, choose your data source then the chart type – you’ve got the full range of visualizations to choose from: status tile, line graph, donut, etc. You can then edit the headers and data, data mapping, labels, and more; it's fully customizable so you can create powerful visualizations that you’ll use every day.
Then repeat the process for the various visualizations you need to create to set up a complete dashboard.
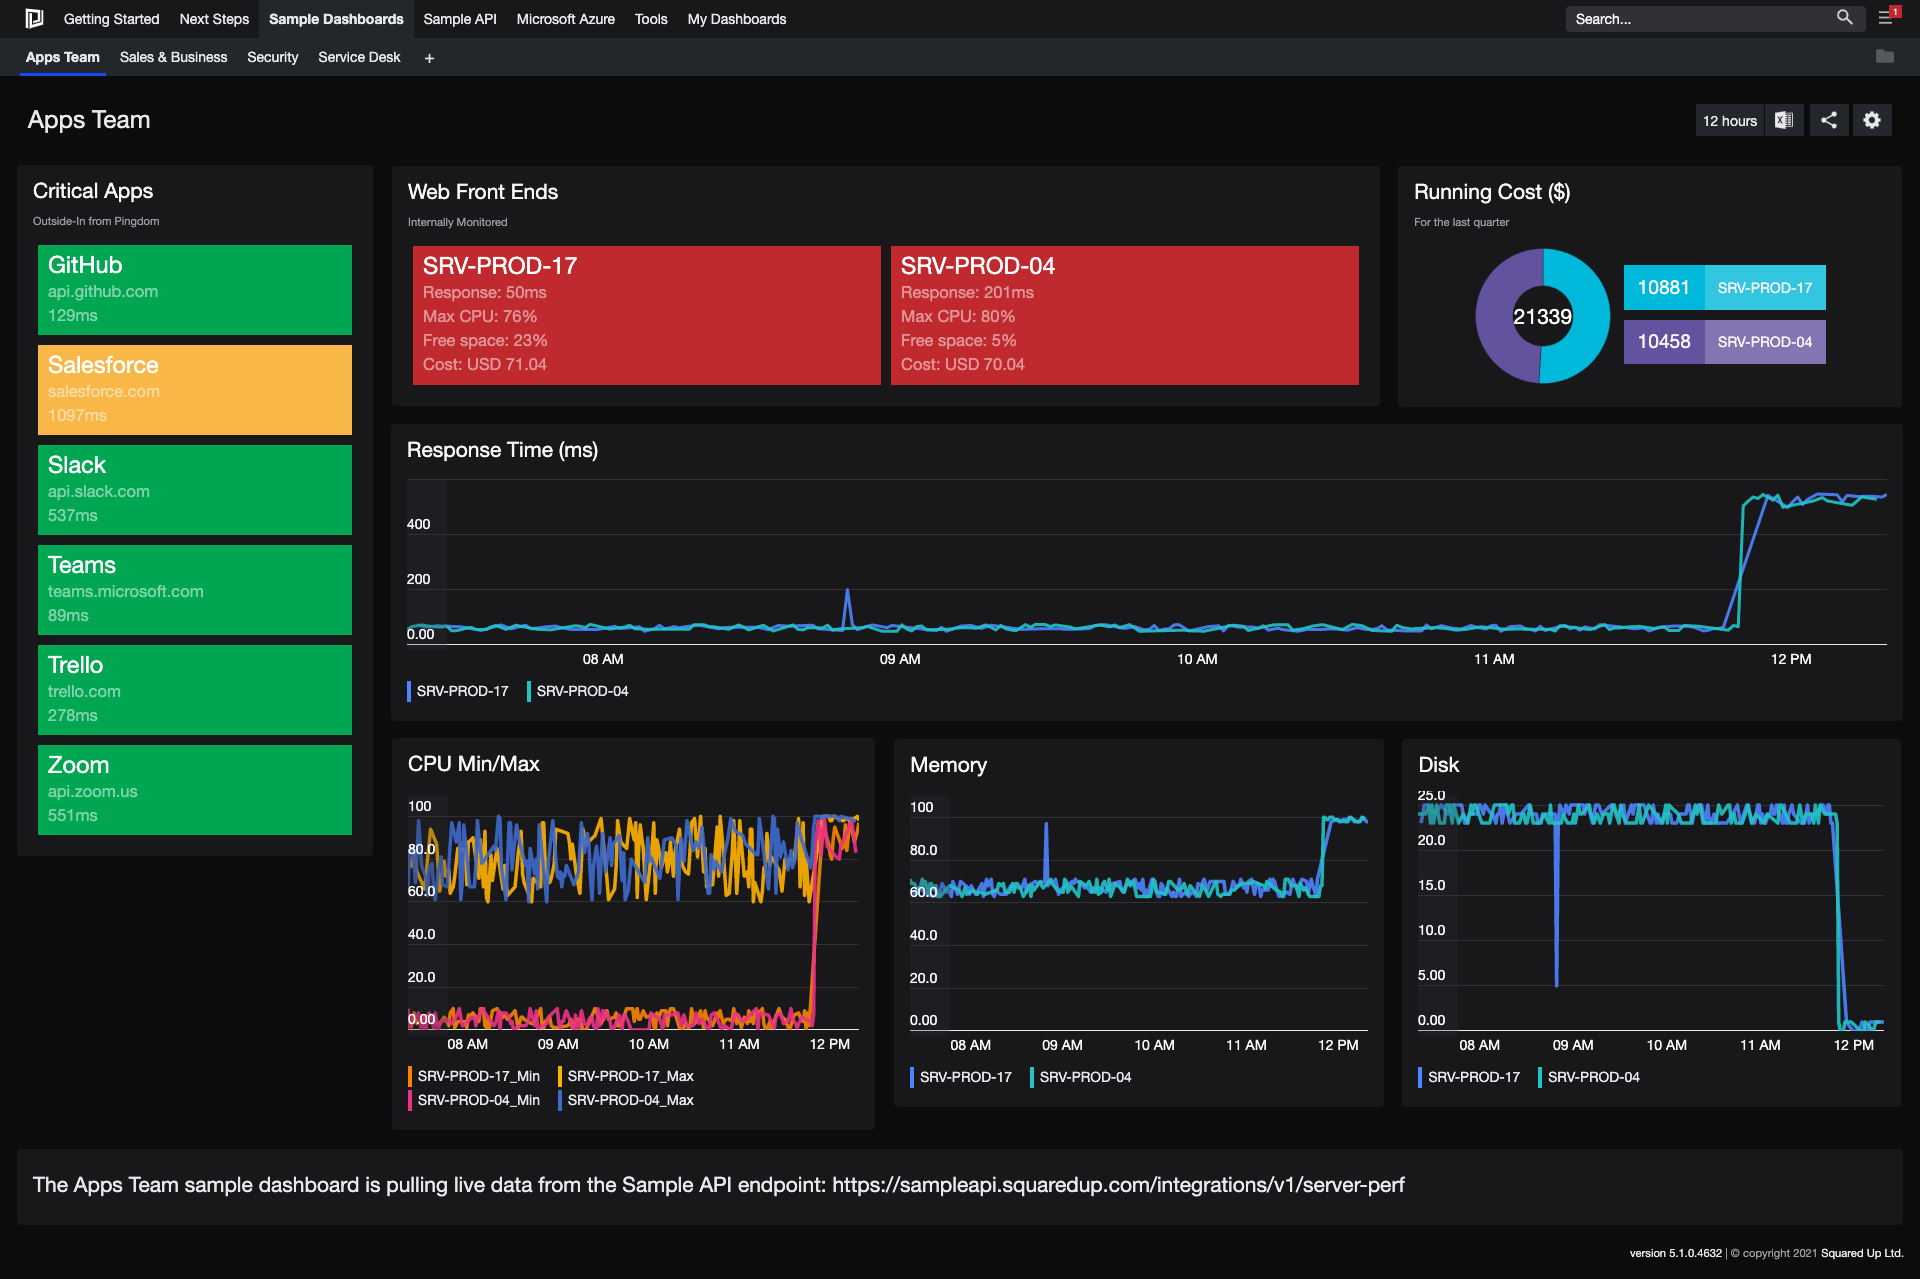
It takes just a few minutes to create something like this…
Share the dashboard anywhere with anyone
And you can share all your dashboards, anywhere, with anyone so everyone who needs it can get full visibility. Just hit the share button. You’ll be given a few options.
‘Normal’ sharing lets other users with a Dashboard Server license fully interact with the dashboard. The Open Access option lets you share the dashboard with anyone but it’s less interactive. Alternatively, you can embed the dashboard where people will see it most – a wall monitor or web page.
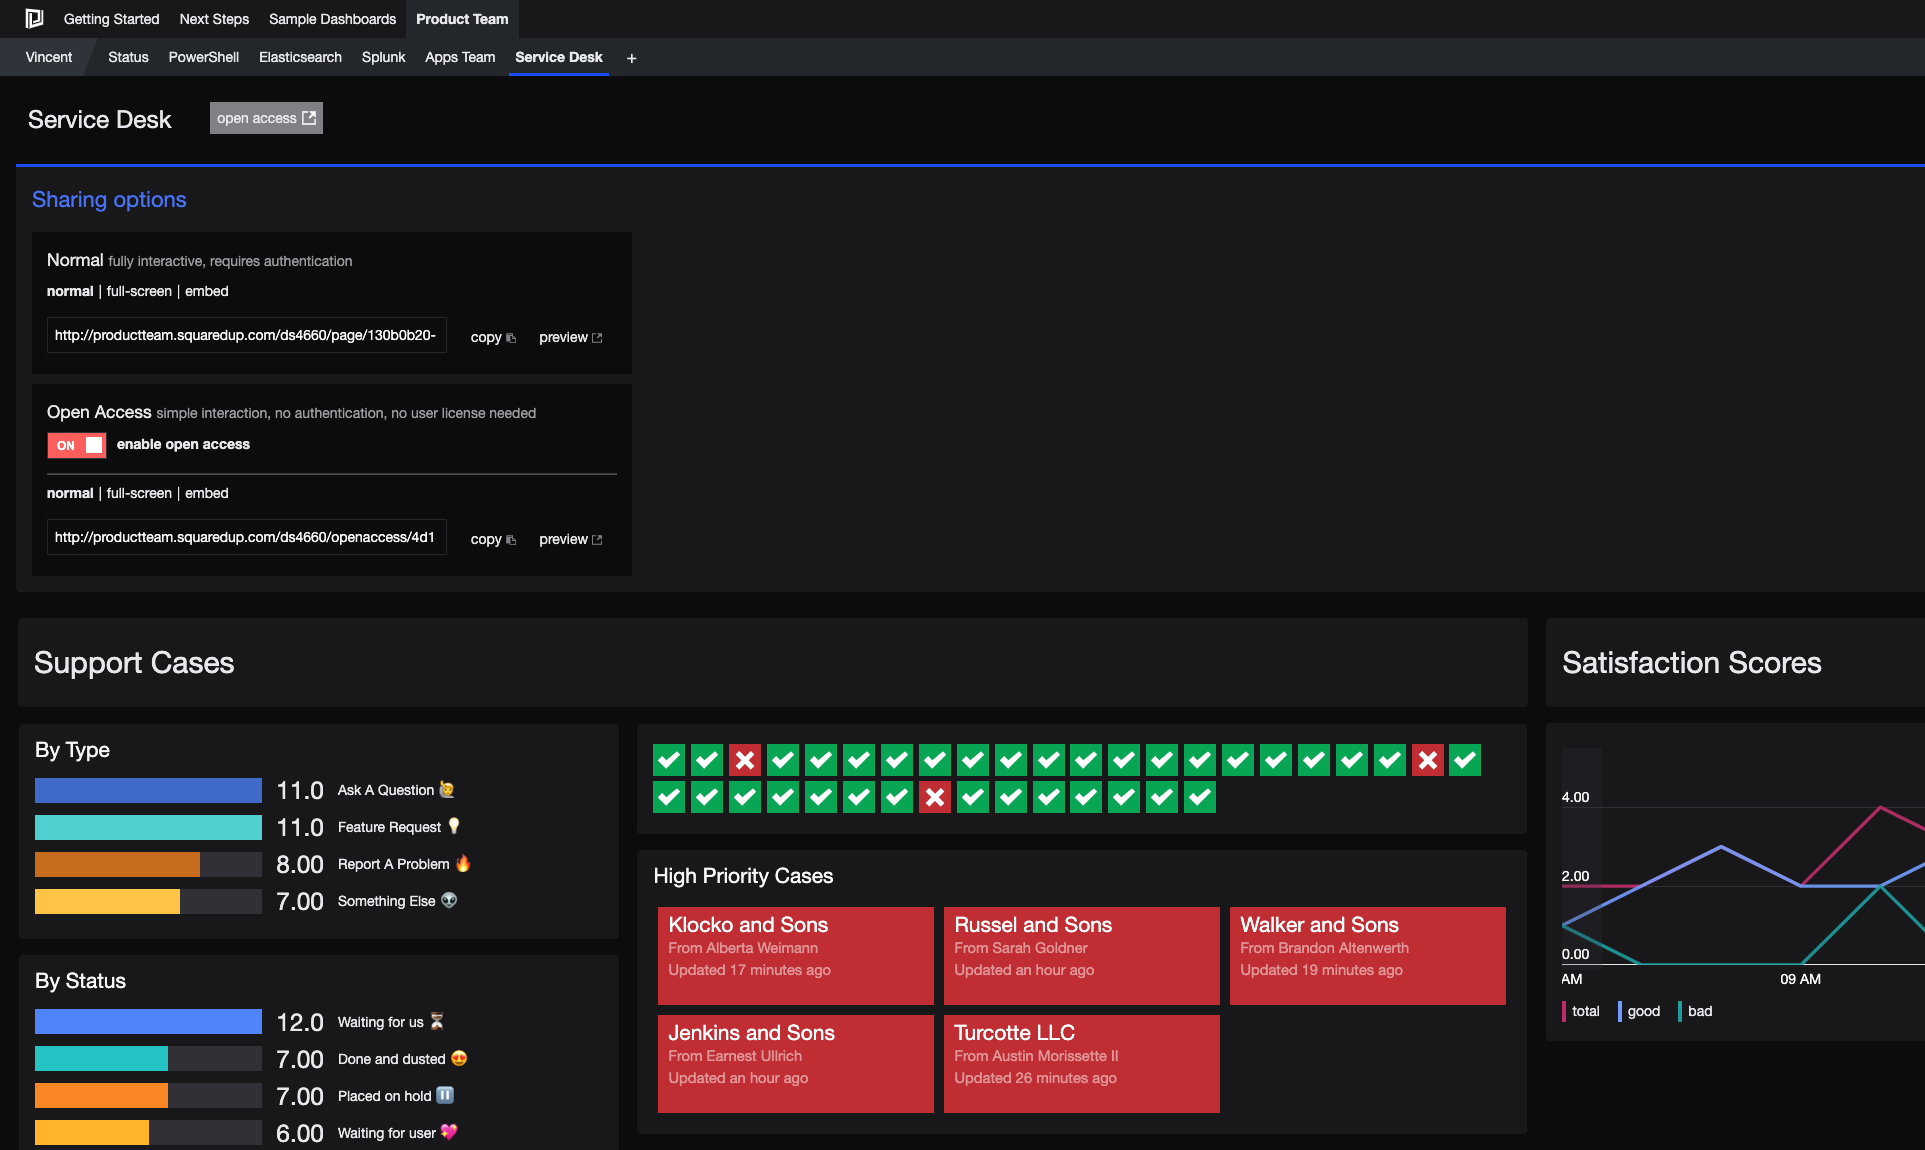
From now on, everyone will be able to clearly see when issues arise and where to optimise. No more scrambling between multiple platforms to figure out the problems or uncover data. Everything is in one place in Dashboard Server.
You can also give management insight into your DevOps data, or any other data you’re reporting on for easy oversight.
Try it for yourself
Dashboard anything for free with Dashboard Server.
Download it and spread the word so everyone can visualize the data that’s important to them and their team.
Then enter the Dashboard Server competition to win some serious Star Wars LEGO! Find out more about the dashboard competition here.