7 reasons you should be on SquaredUp v5 already
If you're still on v4 of our product, we figure you’re doing okay with SquaredUp. It still works well for you. Maybe you feel there are a couple of things that could be improved, but it's not a big deal. So you've not upgraded yet.
And frankly, because it all works fine and is still doing its job, you haven’t kept up to date on all the latest features rolled out in the SquaredUp updates.
But…you’re missing out - on a lot.
There are some major enhancements that could entirely change what you can monitor and the power you can get with SquaredUp.
Plus, it’s really easy to upgrade.
We’re on a mission to make the world’s most complex IT infrastructure beautifully simple to understand, and SquaredUp V5 is our commitment to that.
Here are some of the biggest benefits you’ll get from the latest versions.
1. New Dashboard Designer
First, you’ll find an all-new dashboard designer so you have even more control over the dashboards you build and how they’ll look. You’ll find new layout templates and improved drag and drop. Plus, you can add any number of rows and columns, as well as split columns.

2. See your most important SCOM alert data with a click
Another version 5 addition is the ability to see the most important alert data in your SCOM dashboard with a click.
The new Alert Panel lets you expand any SCOM alert in your SquaredUp dashboard to see the most important information, so you don’t have to tool switch anymore.

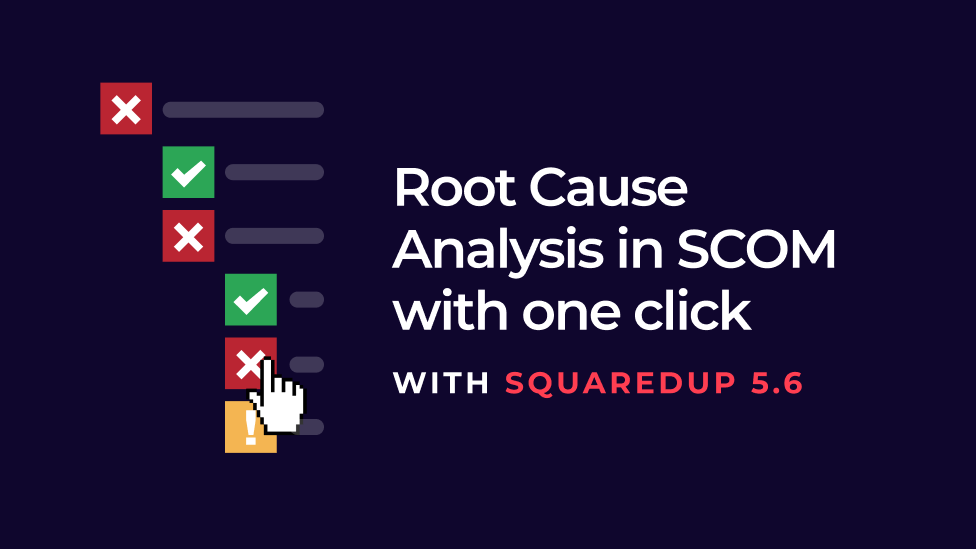
Plus, there are the powerful new sunburst and tree visualizations that give you one-click SCOM root cause analysis and see your SCOM object health at a glance.

3. Deliver more intuitive visualizations
New features also let you build and deliver more intuitive dashboards for end users.
We built the very popular feature of adding conditional color formatting on scalars. A SCOM metric or business number is only helpful if you know whether that is good or bad in the context of what it represents. Having conditional formatting immediately lets end users know if that scalar number is good or bad.

The other huge visualization improvement is the addition of the Surface Tile. This lets you add any image behind your visualizations so you can map data onto any image. Try, for example, using a world map of your server locations with performance data, or an office building blueprint to show meeting room availability, or an infrastructure diagram so you can see health statuses of your objects.

4. Tailor each dashboard for the end user
In SquaredUp v5, there is an all-new Open Access that has self-healing and improved scaling and performance.
You can now also set the default timeframes on each dashboard. This lets you determine the amount of data the end user sees to keep insights hyper-relevant to their use case. If only the last hour of data is valuable, you can select that timeframe. Or, perhaps, this dashboard is an annual tracker and you can set it to show the last 12 months of data.

On the backend, you can change the refresh intervals of each dashboard individually so you can manage refresh loads, while keeping the data updated frequently enough for the end users’ purposes.
5. Beautiful dashboards with more customization
There have also been some great updates that add some small but mighty features and other that fix the niggling formatting annoyances.
You can now toggle on and off dark theme per dashboard. Your wall monitors never looked so good! And, with that, you can switch on or off interaction per dashboard to control whether the end users can drill down into the data or not.

We also overhauled grid tile visualizations so you can resize the columns and change their order to see the data better, filter the data, and even search it with a new search toolbar in the top right.
Plus, on donut charts, you can choose the colors you want for each section.
We simply want to keep creating the very best dashboards for you.
6. Visualize all your enterprise data in one place
Having all your SCOM data visualized in one place is great, but there’s so much more than Microsoft infrastructure that you want to monitor.
First, we introduced the ability for you to connect to any ODBC driver - like PostgreSQL, Oracle, and MySQL - and the ability to use PowerShell to visualize metrics from any data source. This gave you oversight of a lot more of your infrastructure within your SquaredUp dashboards.

Then, more recently, we introduced SquaredUp Dashboard Server: EAM-X to fix SCOM blind spots and let you see all your tools in one place.

The EAM-X tier extends SCOM, to include SquaredUp Cloud capabilities, by plugging in any Data Center or Cloud platform: VMware, Citrix, SolarWinds, Nagios, Azure Monitor, AWS Cloud Watch, Dynatrace, Prometheus, Kubernetes… anywhere your data lives for your enterprise applications.

Now you can see all your tools and platforms in your dashboards while making full use of your existing SCOM and SquaredUp investments.
7. Share dashboards with the community straight from the application
Finally, you can now share your favorite dashboards with the community directly from SquaredUp. It’s great to see dashboards shared with others so everyone can borrow ideas to create slicker experiences and better insights for all the end users.
Upgrade in-place. Easy.
We relentlessly work to deliver value in SquaredUp in all product editions so we also make it super easy to upgrade to make the most of them.
You can upgrade in-place and there are no breaking changes. So there’s no reason to not get the latest version of SquaredUp.
Upgrade for free now.

