All Plugins
Azure
Monitor your Azure environment, including VM, Functions, Cost and more.

- Visualize
- Analyze
- Monitor
- Share
Discover complete solutions
All Plugins
Azure
Monitor your Azure environment, including VM, Functions, Cost and more.
- Visualize
- Analyze
- Monitor
- Share
Instant access to your Azure data
Object types
- Billing Account
- Billing Profile
- Budget
- Customer
- Firewall
- Integration Run Time
- Log Analytics Workspace
- Management Group
- Public IP Address
- Reservation
- Resource Group
- Savings Plan
- Subscription
- Virtual Network
Data streams
- Aggregation list
- Alerts
- App Insights Workspaces
- Application Insights Query
- Availability
- Availability History
- Availability Test Count
- Availability Test Duration
- Available Memory
- Available Memory Bytes
- Average CPU Percentage
- Average Memory Working Set
- Blocked by Firewall
- Budget
- Budget Overview
- Composite Disk Read Bytes/sec
- Composite Disk Read Operations/sec
- Composite Disk Write Bytes/sec
- Composite Disk Write Operations/sec
- Cost
- Cost (Amortized)
- Cost (By Tag)
- Cost (Invoice Details)
- Cost (Location)
- Cost (Service)
- Cost with forecast
- Cost with forecast (accumulated)
- DTU Percentage
- DTU Used
- Data Disk Read Bytes/sec
- Data Disk Read Operations/Sec
- Data Disk Write Bytes/sec
- Data Disk Write Operations/Sec
- Data Space Allocated
- DataFactory Integration Runtime Health
- DataFactory Integration Runtime Metrics
- Exceptions per Second
- Failed Connections
- Filter
- Filter By Tag Values
- Group By
- Group By Tag
- Guest VM Metric
- Guest VM Metrics list
- HTTP 4xx
- HTTP 5xx
- IO Bytes Read
- IO Bytes Written
- IO Requests Count
- Invoice History
- Invoice Payment History
- KQL Query
- Log Analytics Query
- Log Analytics Searches
- Log Analytics Workspaces
- Metrics list
- Monitor Metric
- Monitor Metrics (Multi-select)
- Network In Total
- Network Out Total
- OS Disk Read Bytes/sec
- OS Disk Read Operations/Sec
- OS Disk Write Bytes/sec
- OS Disk Write Operations/Sec
- Overall Web Test Availability
- Percentage CPU
- Process CPU Percentage
- Process IO Bytes per Second
- Process Private Bytes
- Processor CPU Percentage
- Request Execution Time
- Requests in Queue
- Requests per Second
- Reservation Normalized Hours History
- Reservation Percent Utilization History
- Reservation Recommendations
- Resource Graph Query
- Savings Plan Percent Utilization History
- Savings Plan Recommendations
- Sentinel Alerts
- Sentinel Incidents
- Sessions Percentage
- Storage Percent
- Storage Space Reserved
- Storage Space Used
- Subscription Charges
- Subscription Charges Overview
- Successful Connections
- Time Since Last Web Test Outage
- Top Longest Web Test Outages
- Total Web Test Down Time
- Total Web Test Outages
- Transactions
- Utilization Summary
- Virtual Core Count
- Web Test Overview
- Workers Percentage
Dashboards
- Alerts
- Apps
- Costs: Actual
- Costs: Amortized
- Costs: Recommendations
- Costs: Reservations
- Databases
- Functions
- Monitors
- Storage
- Virtual Machines
Continue exploring
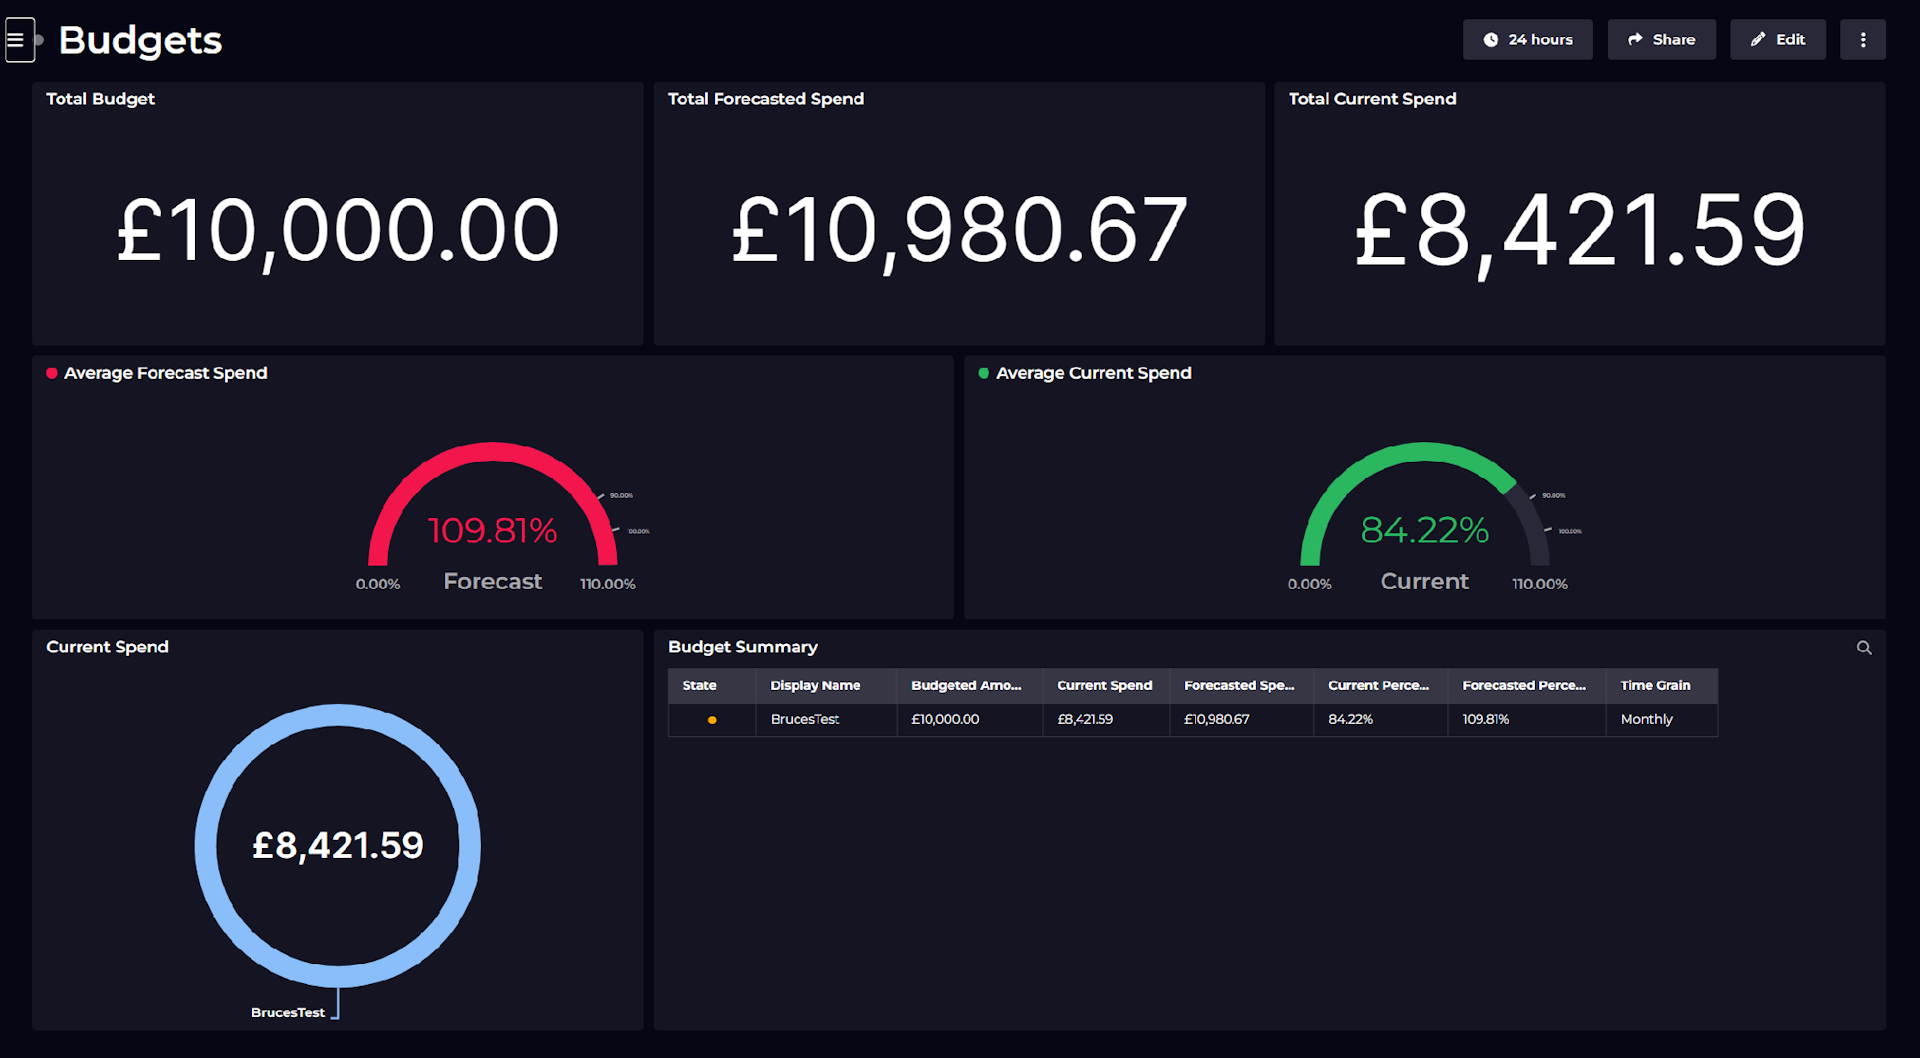
Dashboard Story
Visualize and monitor your Azure costs
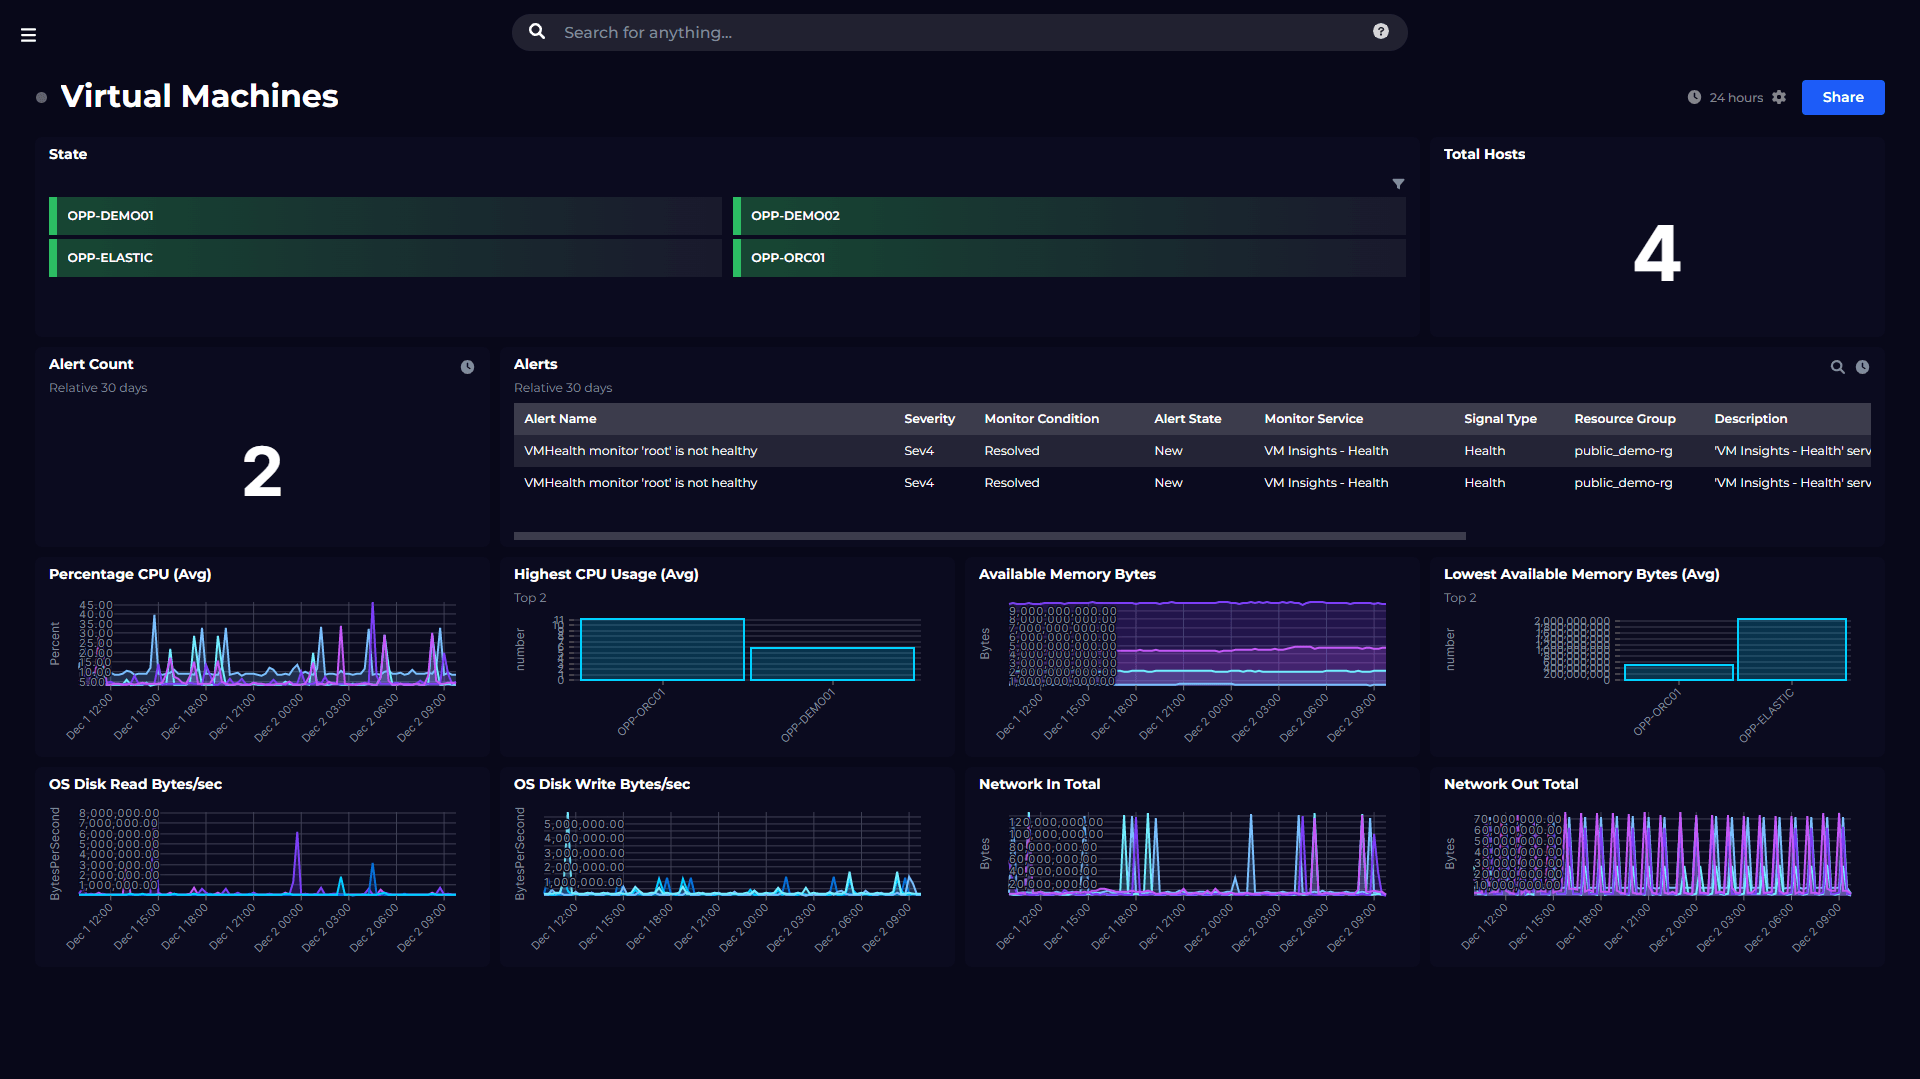
Dashboard Story
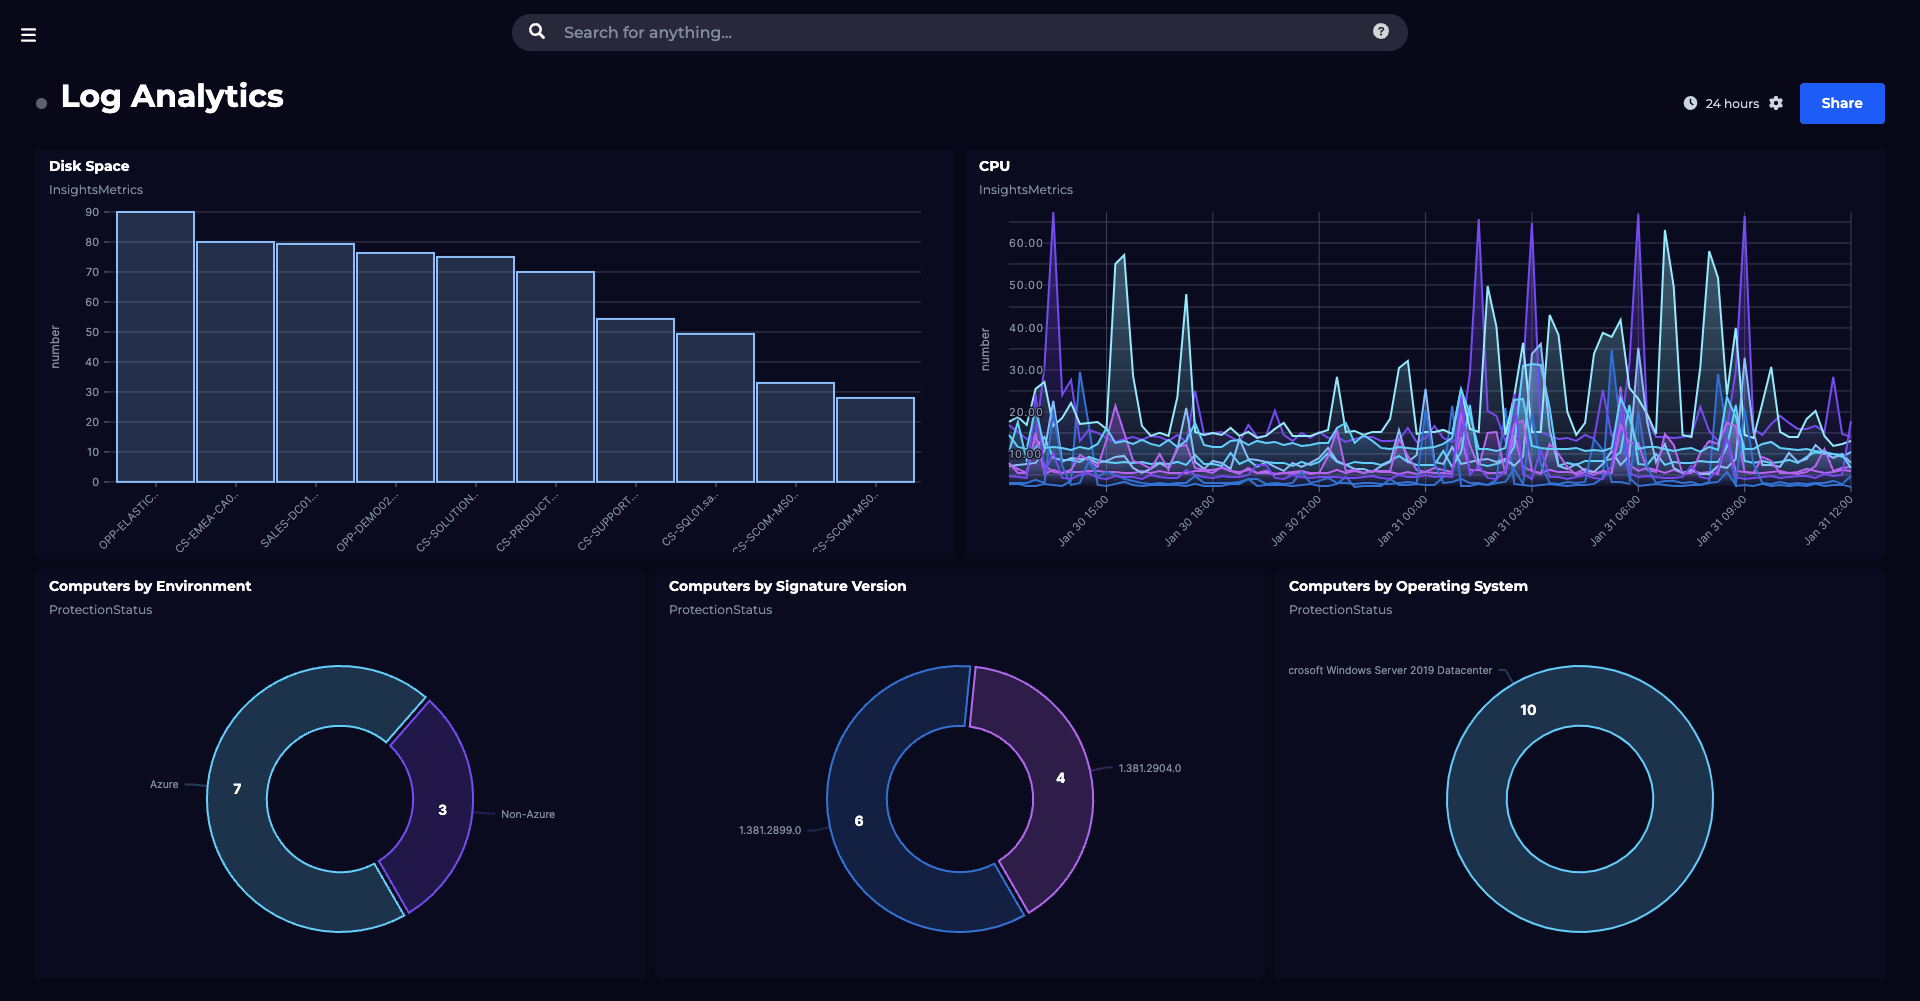
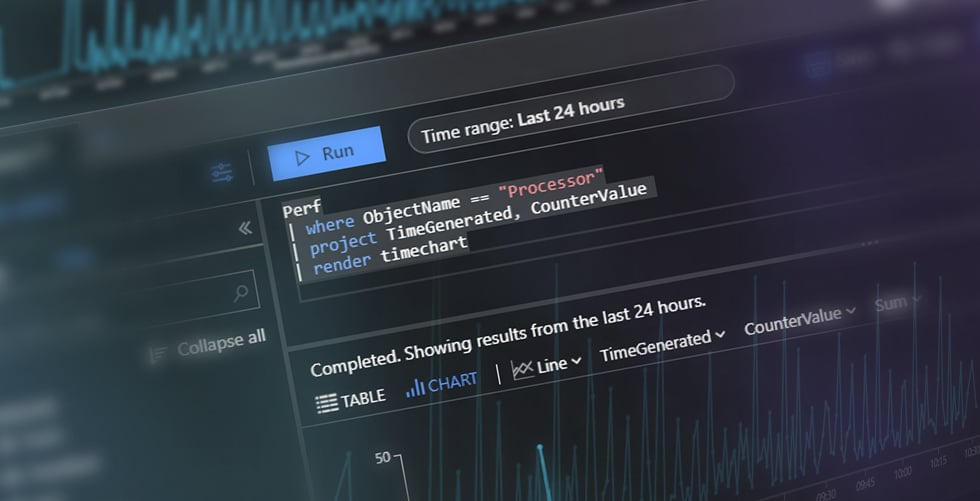
Visualizing key Azure infrastructure metrics
Dashboard Story
Visualize aggregated Azure Log Analytics logs and traces


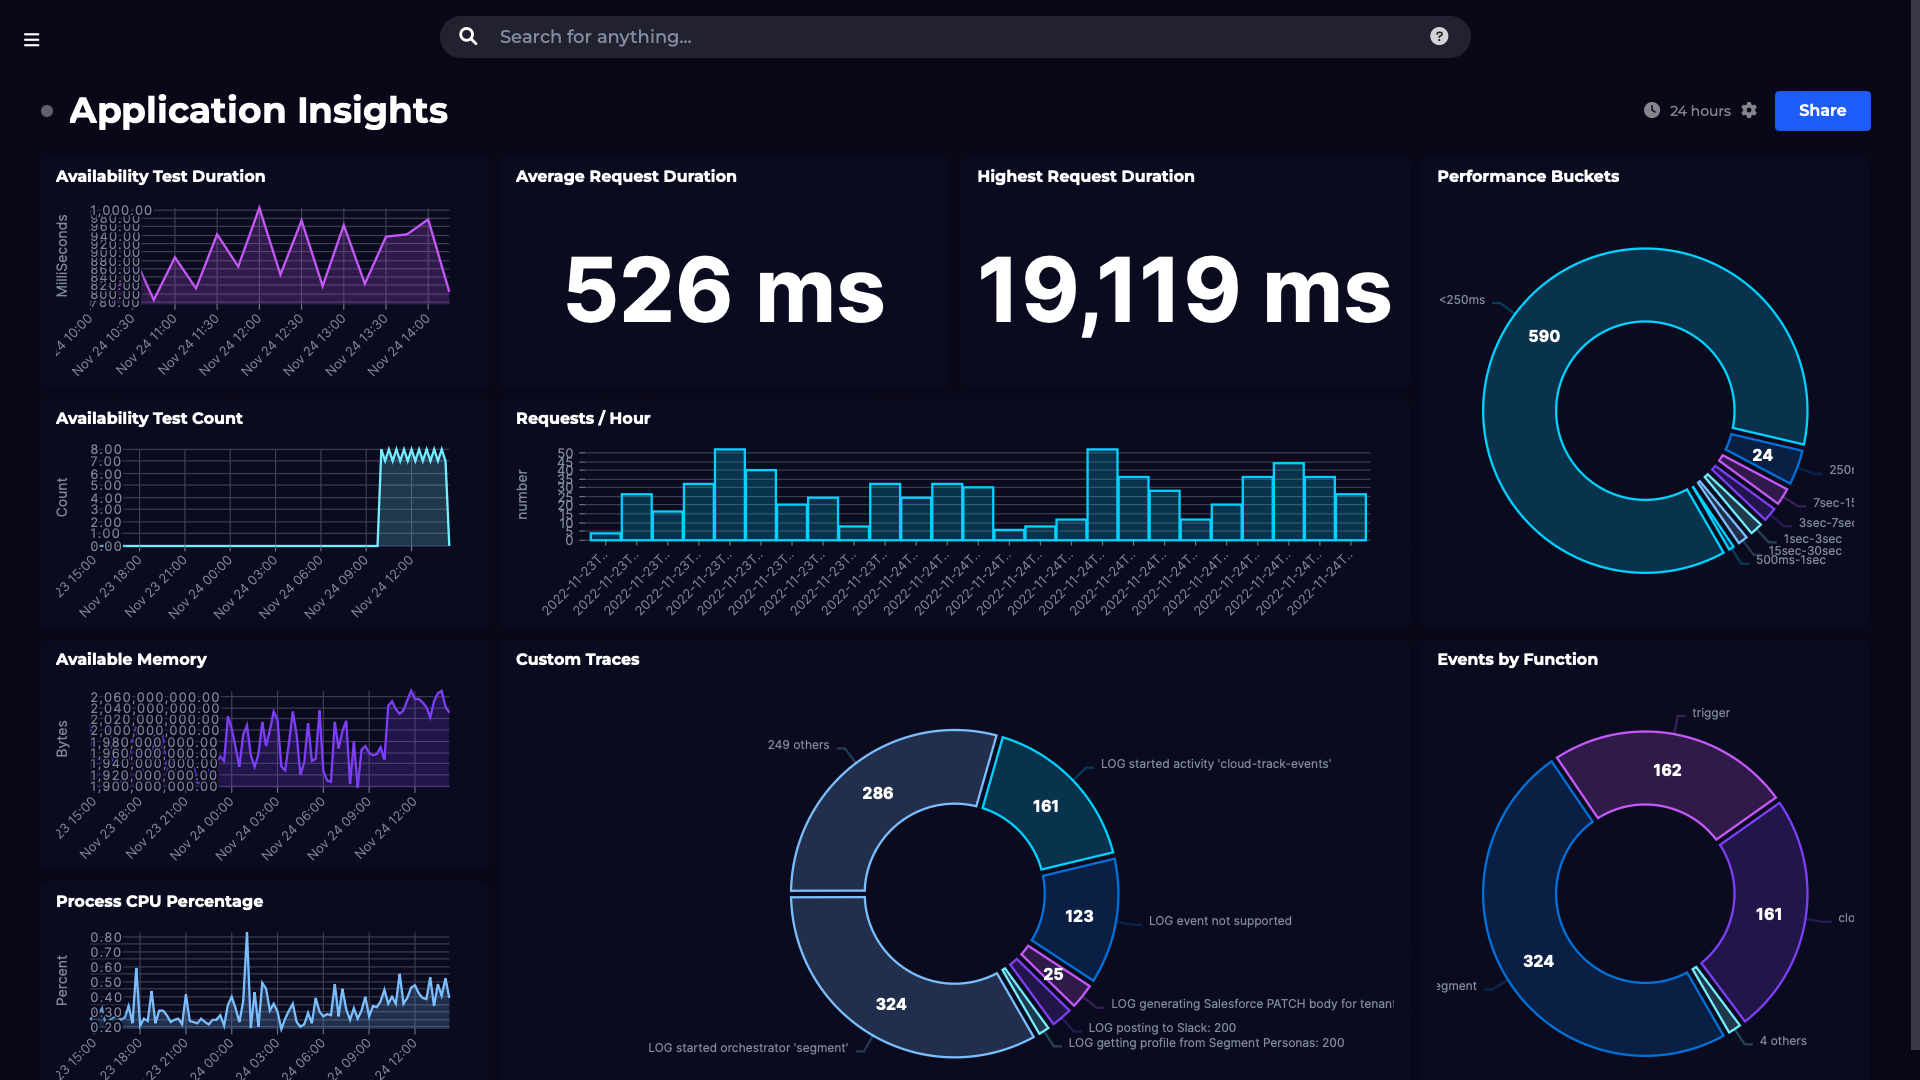
Dashboard Story
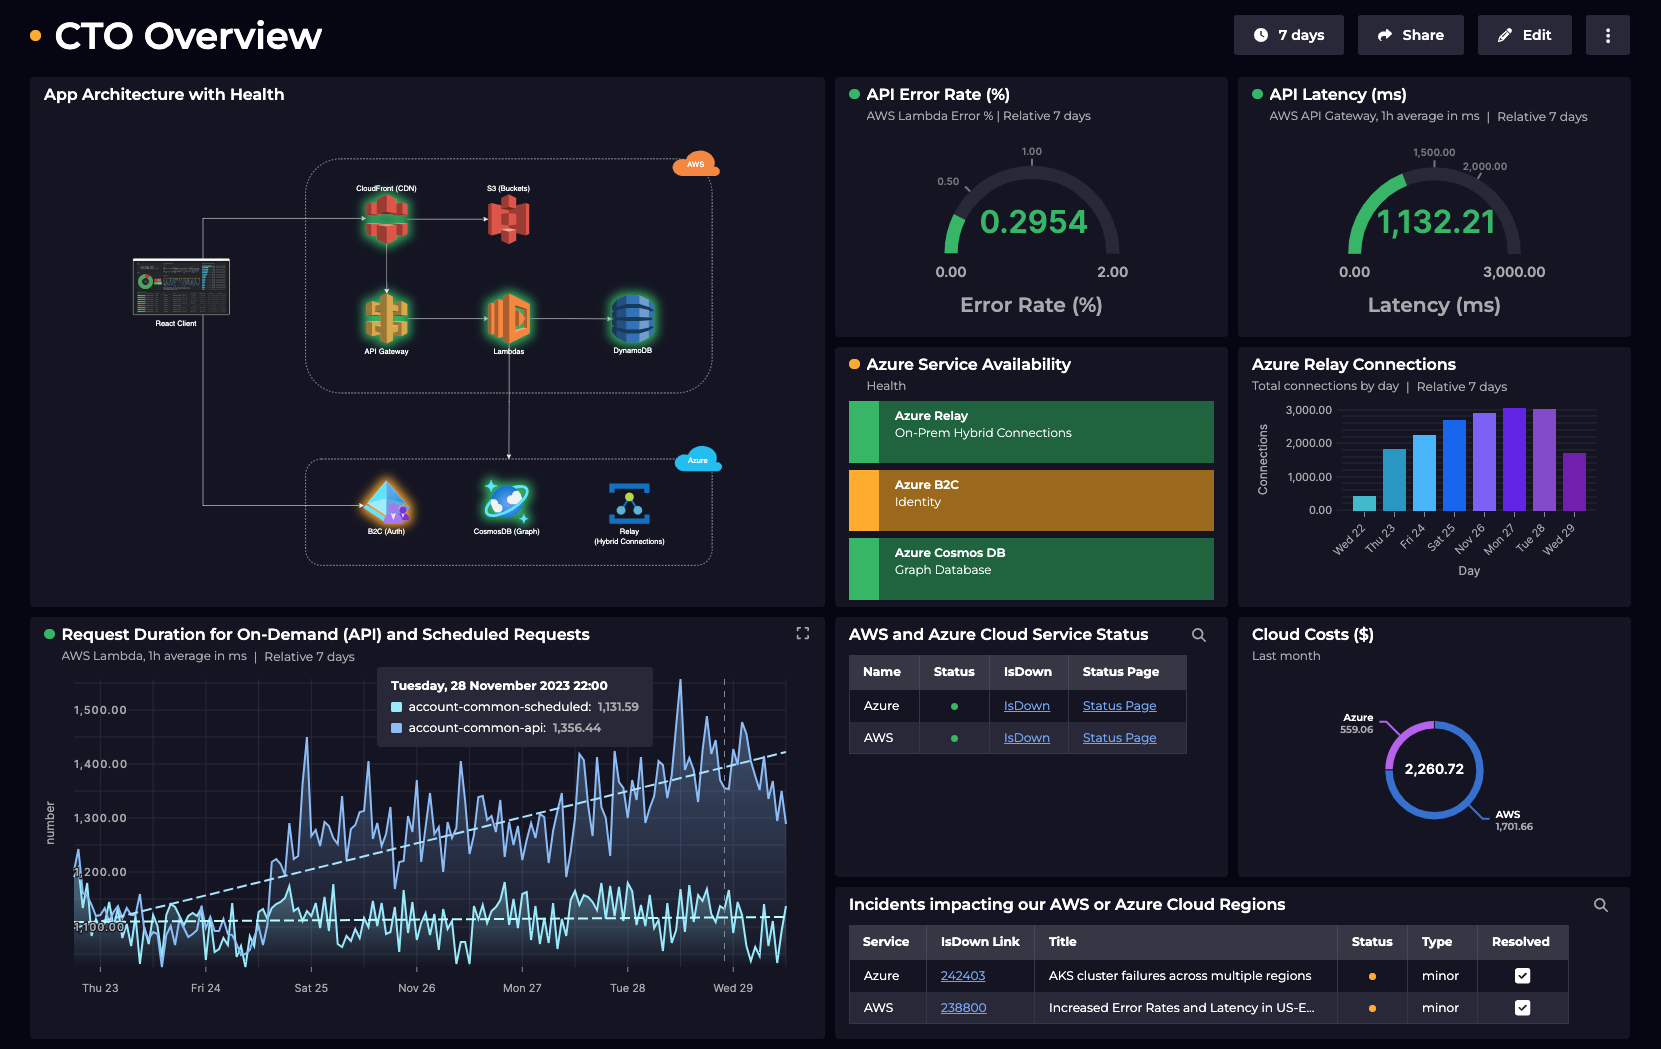
A CTO’s Application Overview
Discover complete solutions
Combine your Azure data with...

Azure App Insights
Monitor your Azure Application Insights environment using custom Kusto queries.

Azure DevOps
Monitor the Builds and Releases from your Azure DevOps environment.

AWS
Monitor your AWS environment, including EC2, Lambda Functions, CloudWatch and more.

Google Cloud Platform
Monitor your GCP environment, including GKE, Hosts and more.

PowerShell
Visualize data from PowerShell scripts
SquaredUp has 60+ pre-built plugins for instant access to data.