


Build beautiful dashboards with KQL
So you’ve now finally finished putting all the pieces together – transitioned to Azure, deployed resources, deployed applications, got familiar with Azure Monitor and set up all the monitoring. You’re now collecting all the monitoring, application performance and security data for your Azure resources in Log Analytics workspaces, ready for analysis. (Head over to our Azure Monitor Learning Path if you're still figuring out how to do all that.)
But is only the collection enough? To actually implement any meaningful monitoring, you also have to act upon the data collected, and what’s the first step to doing that? You guessed it – visualization!
Sure, the Azure portal offers some useful platform metrics, but in addition, you also have a lot of data in your Log Analytics workspaces, stored in tables. This data can only be extracted using the Kusto Query Language (KQL). Naturally, your next goal now is to look for a way to meaningfully display this data using KQL, that is:
- Accessible to everyone (in and outside of Azure)
- Easy to make
- Easy to understand
Enter SquaredUp! You can easily achieve all of the above, and much more. All with a free account.
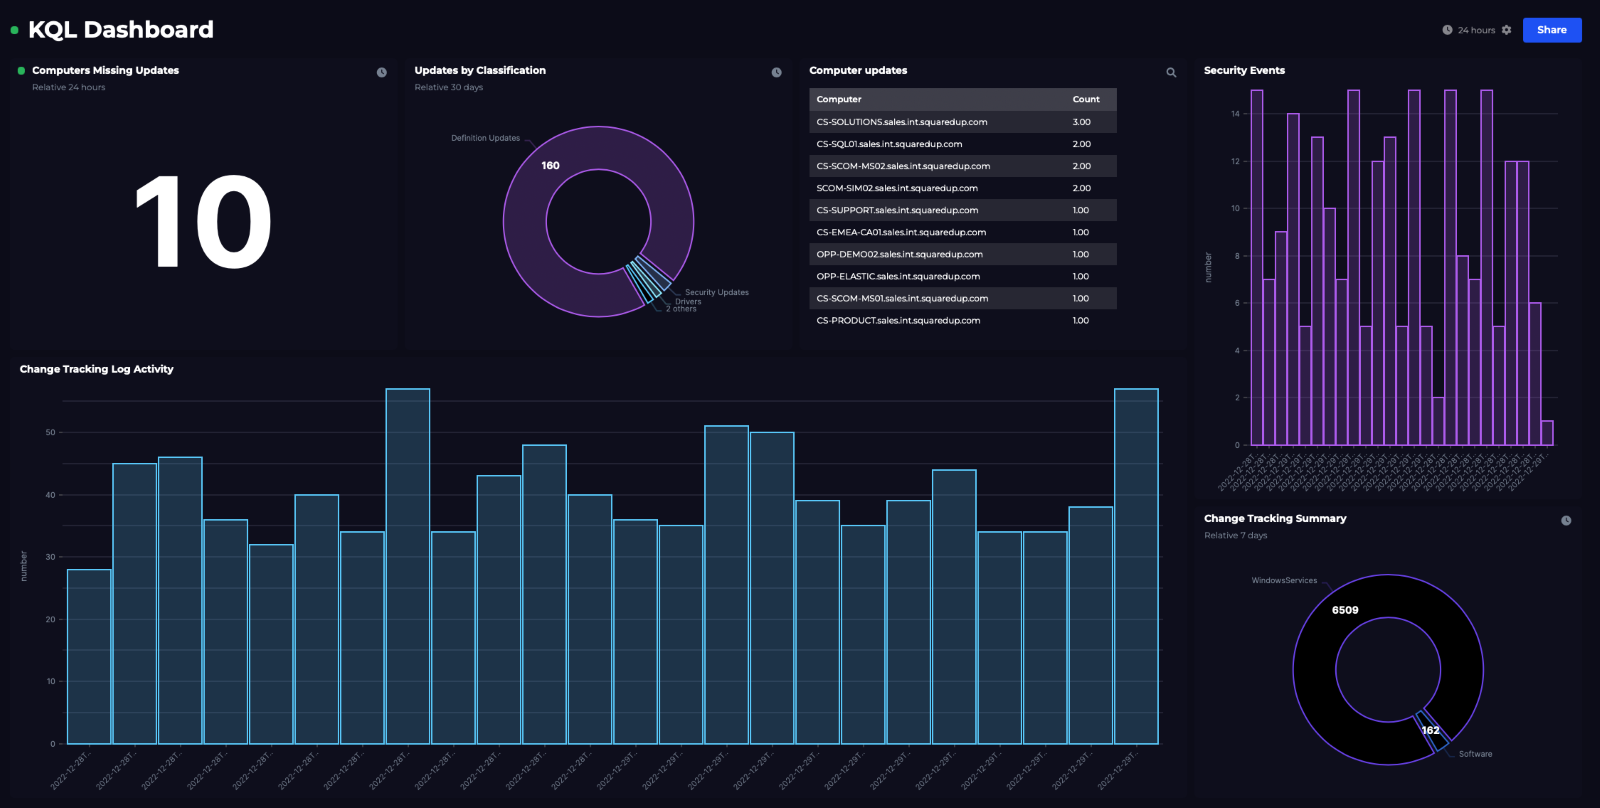
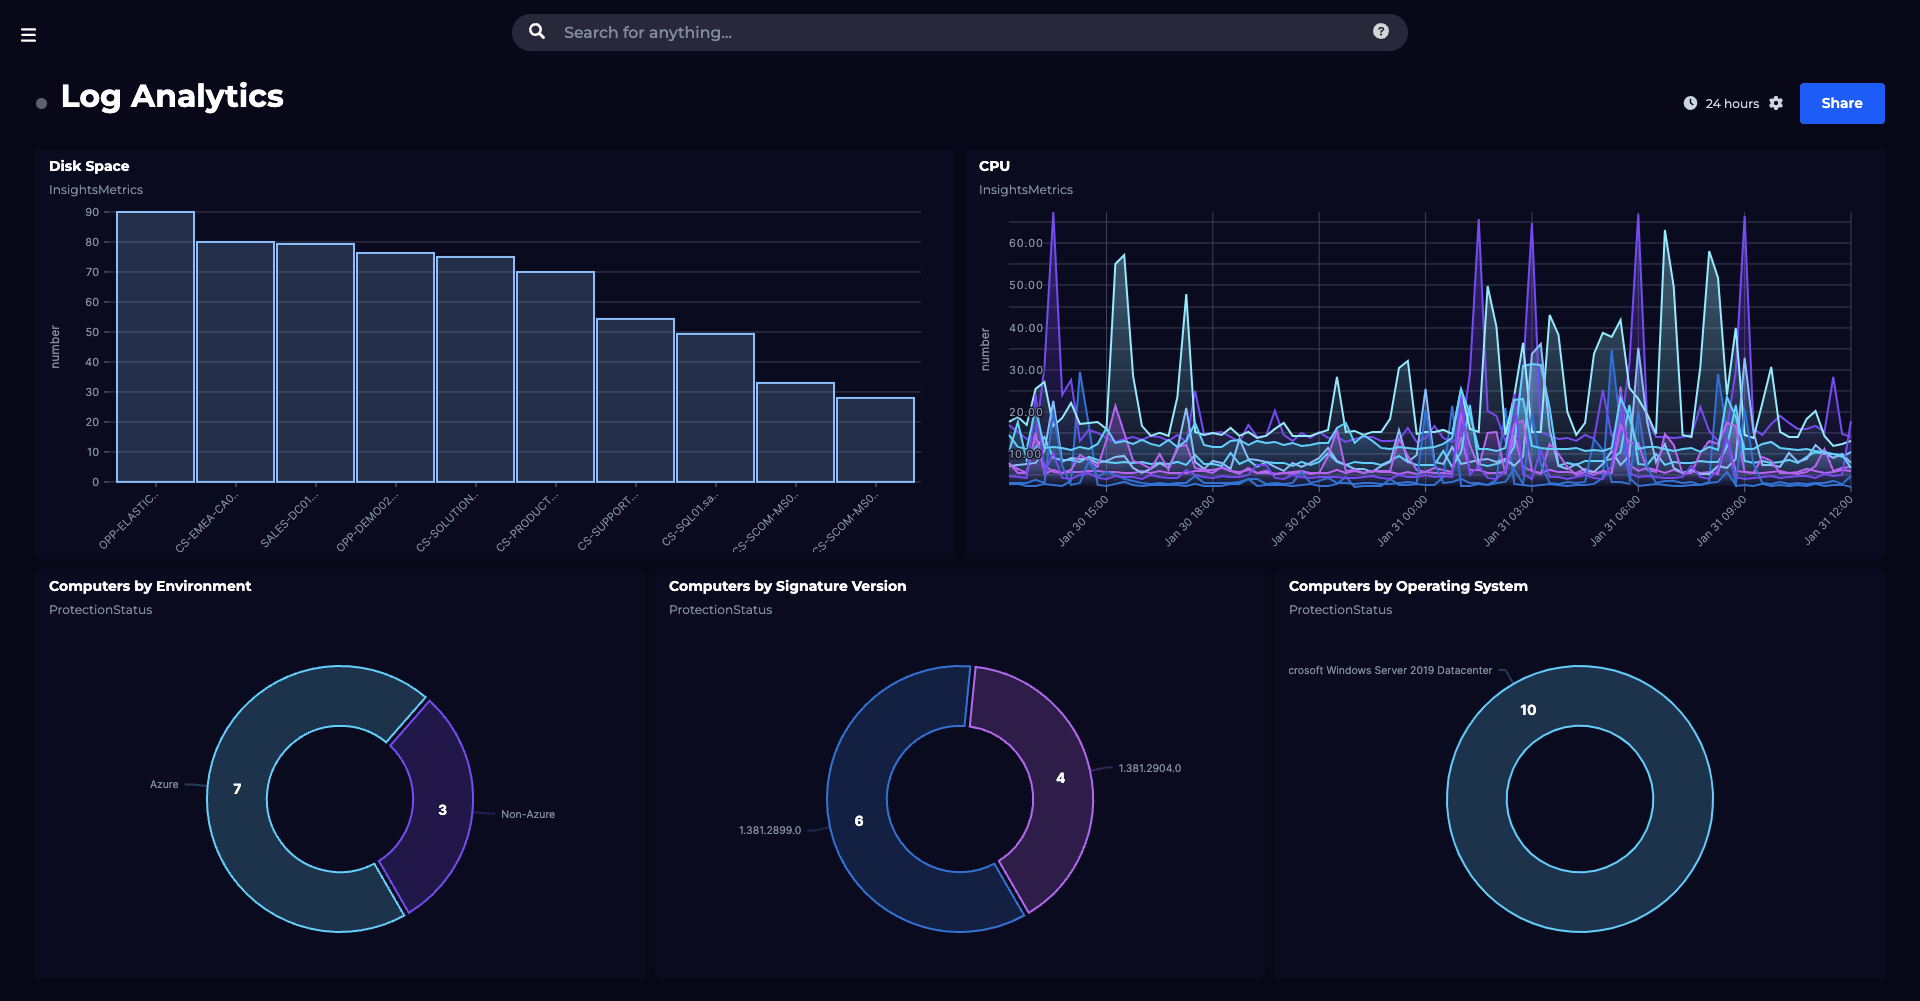
Take a look at a sample SquaredUp dashboard, made completely with KQL:
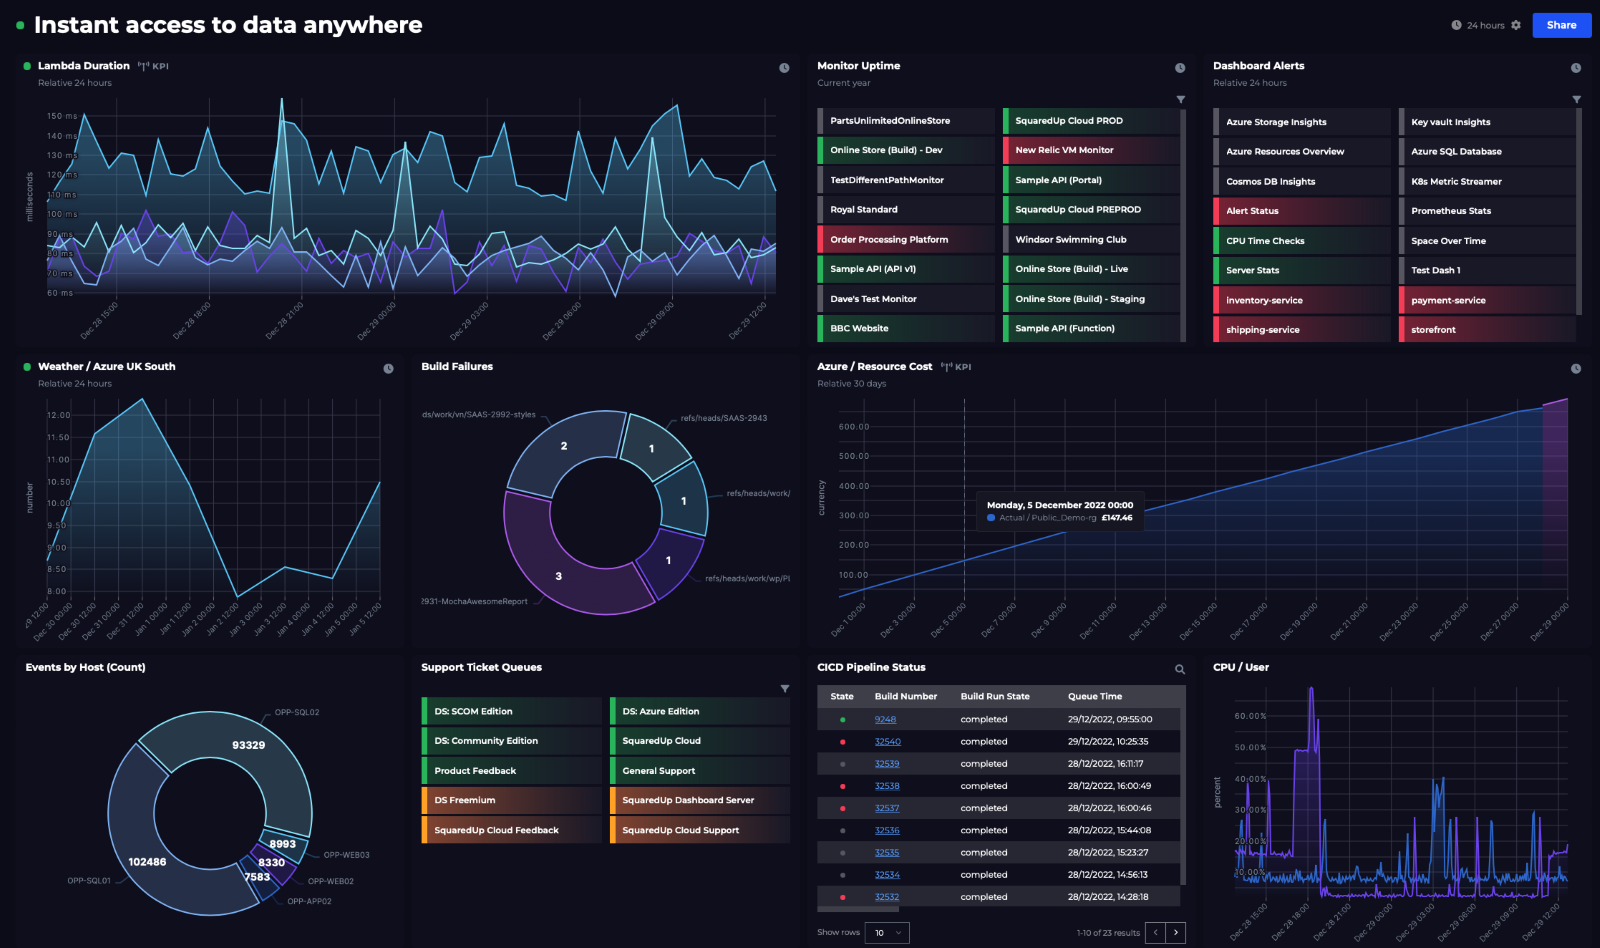
In addition to the dashboards you can create with KQL, you can also plot your platform metrics, view cost information, and connect to a range of 100+ external tools. Here’s an example of a comprehensive dashboard for an application from multiple aspects:
Apart from the cool features mentioned above, SquaredUp enables you to get so much more mileage out of its native KQL integration. Here are just a few things you can try:
- To put these insights to use, you might want to set up monitoring and configure alerting (e.g., for Slack, Teams, or ServiceNow).
- When you monitor individual tiles within a Dashboard, you can then roll up status to the Dashboard and Workspace levels, enabling your team to easily report KPIs across different teams in your organization.
- Additionally, you could scope a KQL dashboard to include additional, related tools (e.g. Azure Monitor metrics) to better connect, aggregate, and monitor crucial data across your infrastructure and applications tools, all in one place.
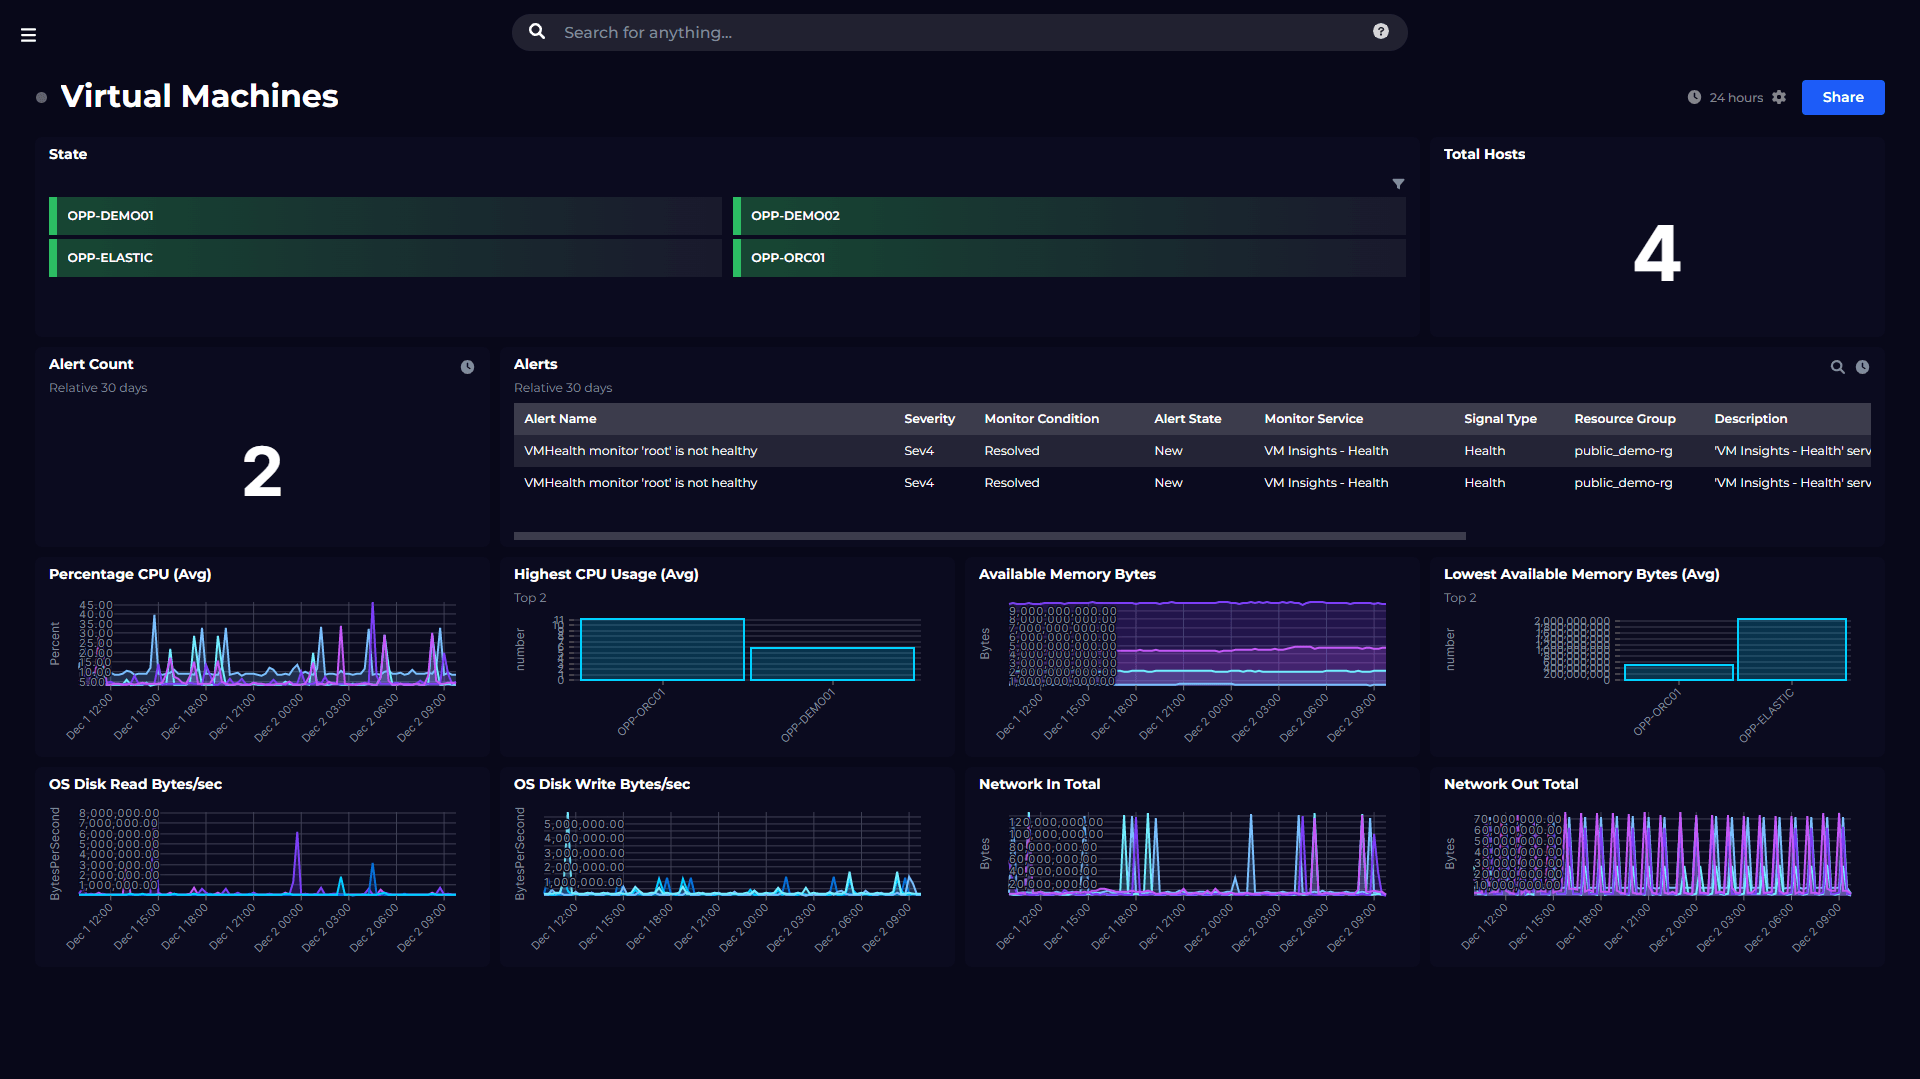
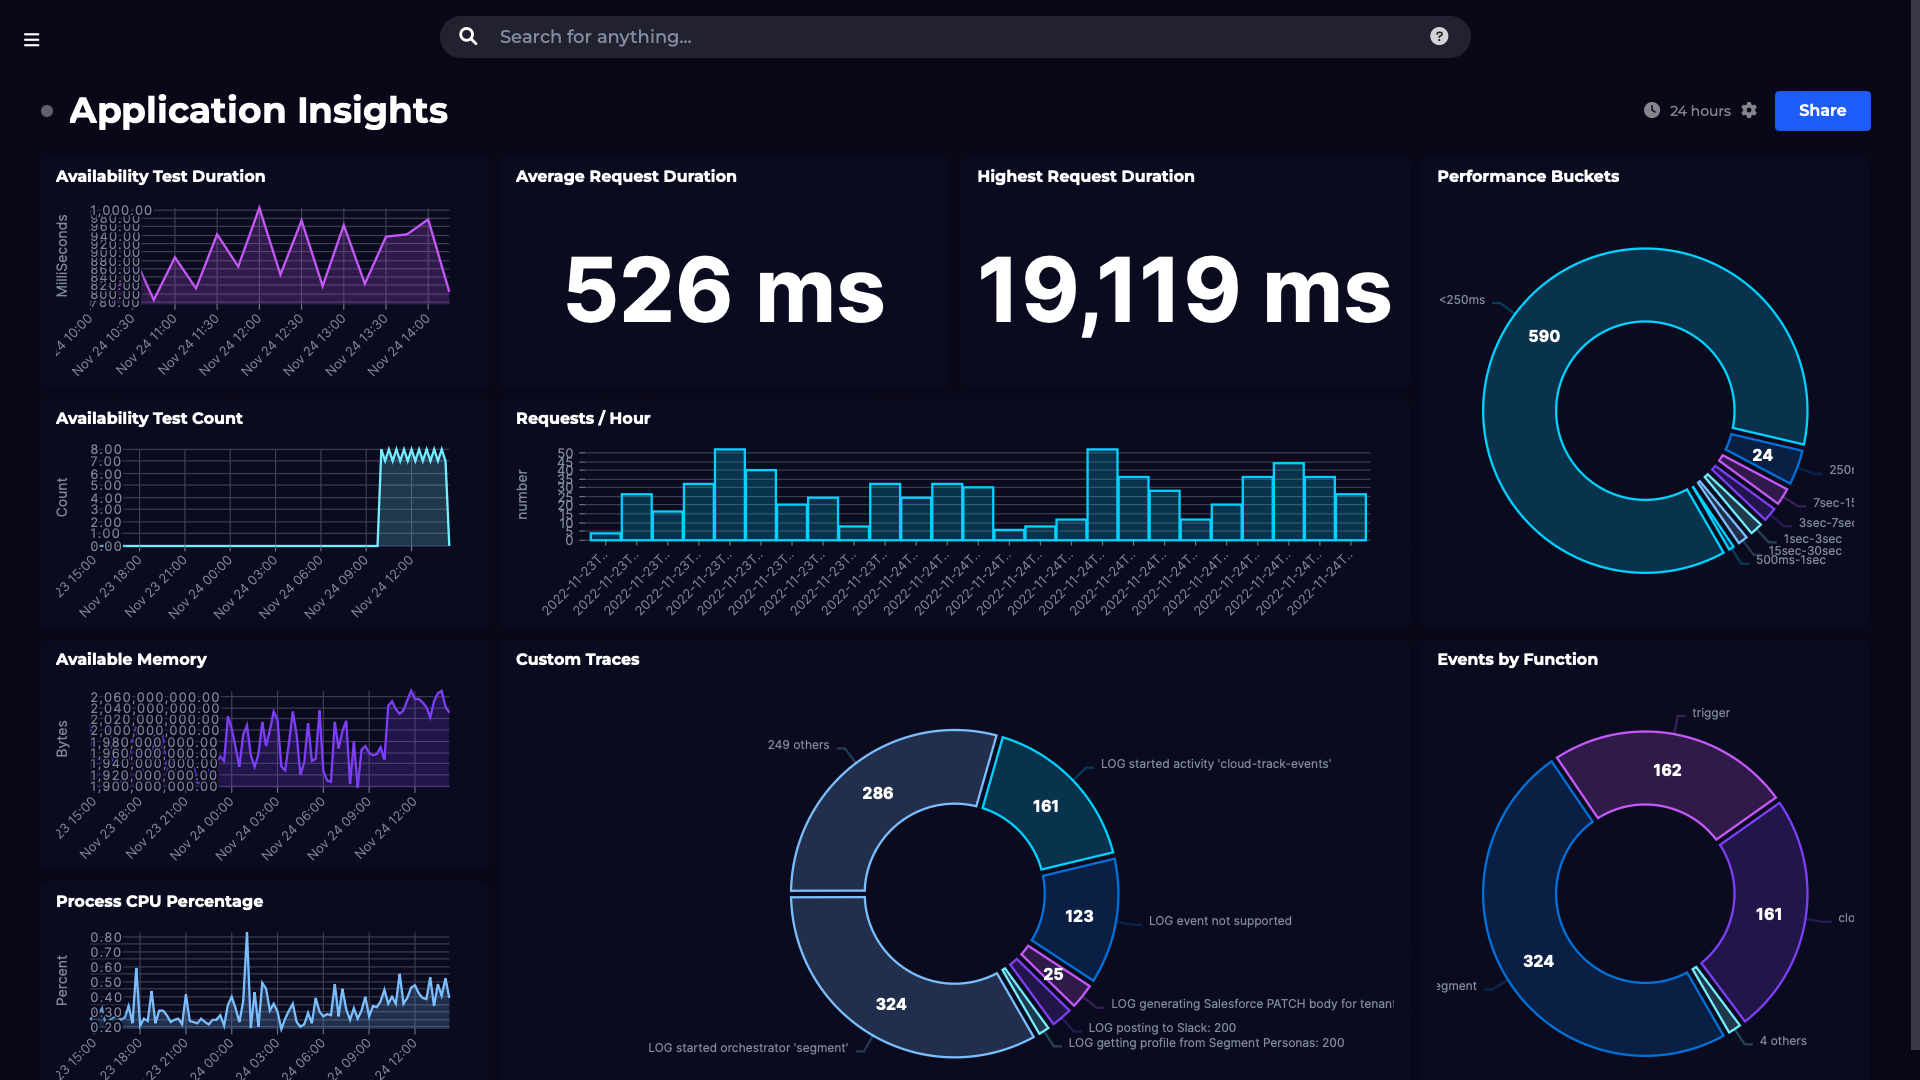
For more examples of how SquaredUp can transform your Azure data into beautiful dashboards for the whole team, check out our dashboards for Azure, Log Analytics & Application Insights.
If you'd like to try it for yourself, sign-up for free!
Related plugins
Azure
Monitor your Azure environment, including VM, Functions, Cost and more.

Azure App Insights
Monitor your Azure Application Insights environment using custom Kusto queries.
SquaredUp has 60+ pre-built plugins for instant access to data.
Related solutions

KPI and scorecards
Work on shared goals. Get better results.
Related content
Dashboard Story
Visualizing key Azure infrastructure metrics
Dashboard Story