Adam Kinniburgh
VP Innovation, SquaredUp


Join the SquaredUp Tech Evangelists on their Azure Monitor journey as they learn all there is to know about the platform. For a brief overview of the Azure Monitor Learning Path series, check out Sameer’s intro note.
In the last few posts, Sameer has walked you through various aspects of Azure Monitor Logs and I’m sure you’ll agree that it’s a very powerful tool when it comes to gathering and analyzing data from your Azure resources and beyond.
In this post and the next, I’m jumping in for Sameer to talk about Application Insights, which is a different beast altogether. I’ll start with what it is and a simple use case, and in the next post we’ll get into some real-world configuration and use cases that should highlight how valuable it can be to your monitoring strategy.
Application Insights is a tool that would commonly be referred to as APM, or “Application Performance Management”. APM tools sit a layer above traditional resource monitoring and focus on the performance and availability of the software applications running on them.
APM tools are used to detect and diagnose complex application performance problems. They do this by measuring all aspects of your application, both on the inside at code-level and from the outside where the focus is typically on end-user experience. Sure, you can do some really cool stuff with Logs and Metrics from your resources, and with KQL you can probably divine some cross-resource insights that might hint at how well your app should be performing overall, but if you want to really up your game you need to start monitoring your apps as well, not just what they run on.
Application Insights isn’t the only option though and, in fact, APM is a very saturated space. If you’re serious about monitoring your critical applications you’ll likely have come across Dynatrace, AppDynamics, Datadog or New Relic, to name a few of the big boys. This post is in no way intended to provide any comparison but what I will say is, if you’re running your applications in Azure and utilising other parts of Azure Monitor, Application Insights represents a great opportunity to keep things simple.
Let’s start at the beginning. Like a Log Analytics workspace, an Application Insights instance is an Azure resource like any other and you set one up in the same way. Let’s start by searching for it in the Azure Portal.

From the Application Insights blade, click the Add button. Now before you start filling out the basics, I just want to quickly discuss a consideration for the options you’re about to set. My personal best practice here is to provision one instance per application, with an obvious name and deployed into the same resource group as the rest of the app. This means that each app has its own dedicated space for monitoring, and it makes it simple to give granular permissions to your various app teams. There’s also a cost to use Application Insights and having per-app/per-team billing is often required.
So, with all that in mind you can complete the deployment wizard then grab a coffee while your new instance is created.

Now just hit the “Go To Resource” button when it’s done.
Now that you’ve got an instance to play with, let’s dig into some of the basics. First though, I want to address the obvious elephant in the portal, and that’s the Logs button right at the top of the Overview pane.

I mentioned earlier that Application Insights is an APM tool that was different to Azure Monitor Logs, but also keep in mind that this is still part of Azure Monitor and as such, just like Azure Monitor Logs, all the juicy APM data you’ll be collecting will be piped into the underlying Logs and Metrics databases. This can then be queried, operated on and visualized using all the skills you gained earlier in this series. If you’re struggling with this, think of Application Insights loosely like a solution… it gives you an interface to configure specialized tools that collect new types of data from new data sources.
So back to it… The navigation panel on the left is helpfully broken up into categories, three of which are worth talking through briefly.
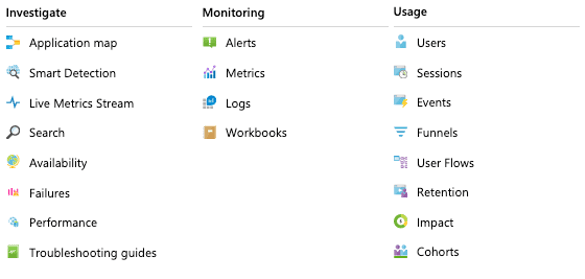
Investigate includes the tools that provide your core application monitoring. They’ll help you figure out if your application is available, how well it’s performing as well as identify issues and assist with diagnosis.
Monitoring is a common section for all Azure resources and gives you access to the raw data being collected about your app, namely through Logs, Metrics and Workbooks. You’ll also see Alerts in this section.
Usage is very specific to APM in that it focusses on user behaviour. In other words, the analysis of how your app is being used, how long users spend on it, how they navigate it, and whether they come back.
We’ll get into the day-to-day use of these tools in more detail in the next part of this series, but for now, let’s try setting up some basic monitoring for a website running on a mix of Azure PaaS and IaaS resources. Let’s go with a really simple and effective outside-in test that’ll measure availability and response time from around the world.
This is a great place to start as availability tests are a very effective way to check that your critical apps are responding and performant. You can also use it to check that a website is available and whether it’s yours or not. If it’s accessible over the internet, you can test it using Application Insights.
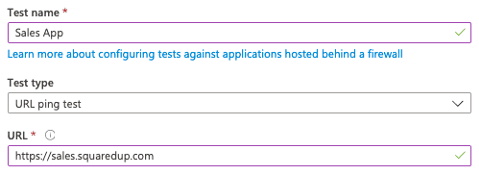
Start by selecting Availability from the Investigate section, then click the Add Test button at the top. You’ll be presented with a simple configuration panel which we’ll walk through now.

Start by giving your test a name, and then enter the URL your users would use to access the website. In this case, we’re setting up a test for our demo Sales App which is accessed via https://sales.squaredup.com so I’ve entered those details here.
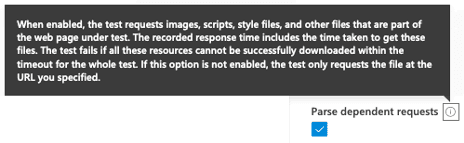
The next option, “parse dependent requests”, enables the test to load the whole website i.e. images, style sheets etc, and the test result is based on that whole process rather than just the initial HTTP response. I’ve chosen to enable that option in this case, but you can leave it blank if that suits your case.
The next option, “enable retries for availability test failures”, allows the test to be repeated if it fails and it’ll only record a failure if it fails three times in a row. I’ve chosen to leave this enabled as it helps make the test a bit more real life. There are countless reasons outside of our control why a website might not completely load the first time and this option helps you take that into consideration.

The next option, “test frequency”, is simply how often you want the test to run. I’m leaving the default of 5 minutes and moving on to “test locations”. Expanding this section reveals a number of familiar options, in that they’re all Azure regions. The options you choose here represent which Azure datacentres your test will run from. It’s worth considering how to make this realistic by thinking about where your users are so as an example, if all of your users are in the United States you might only pick West, Central and East US as your test locations.
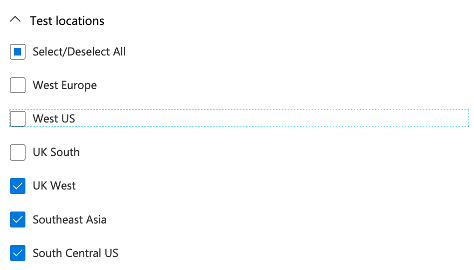
In this case, I’ve chosen a few locations from all around the world and have moved on to the “success criteria” section. This section defines what constitutes a pass or a fail when the test runs and I’ve left all the options as default in this case.
Just to quickly call out a really powerful option in this section—“content match”, which allows you to set the test to check for specific words on the page and fail the test if they’re missing. And why is this so powerful? Well, it’s not uncommon for sites to respond with a custom page like “down for maintenance” that this test wouldn’t otherwise be able to distinguish from a successful page load. By getting the test to look for something that would only be there if the site has loaded correctly, you can handle those cases easily.

The final option is to enable or disable alerts for your test. Personally, I always leave alerts enabled as I’ve never seen the point of monitoring anything if I don’t care about it being down, and alerts are the best way to know when something needs my attention. A good universal monitoring tip for you there.
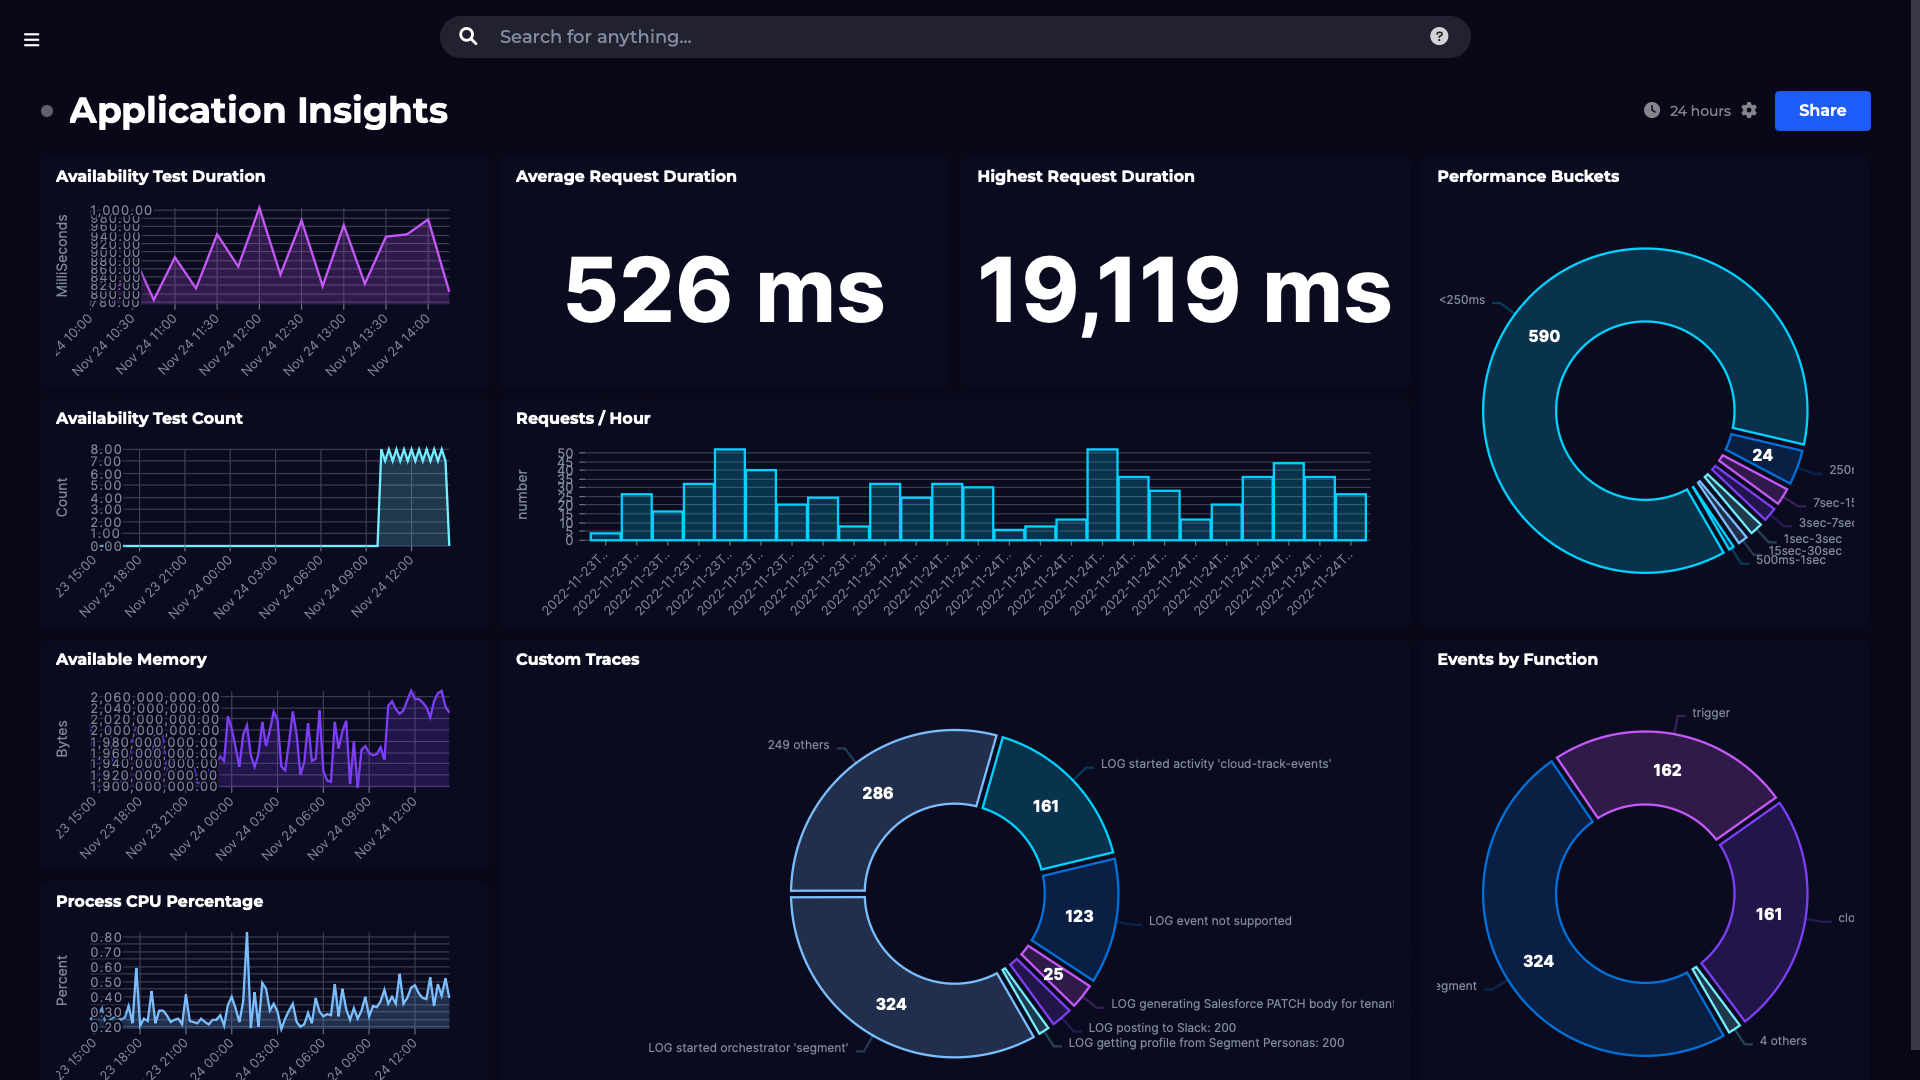
Once you’re done, just click “Save” and the test will be created but note that it’ll take a few minutes for the first result to appear. Once some time has passed and you have a few results, you’ll see something like the image below. Note that if you switch the chart view between “line” and “scatter plot” you’re also switching between the availability percentage and the test duration.

You can now sit back and marvel at your accomplishments, poised and ready for an opportunity to tell your colleagues with great certainty that your website is not only available but is also really fast for the populations of Brazil and Australia. Legend!
We’re going to wrap up for today but check in for the next part where I’m going to walk you through some much deeper application monitoring using Application Insights to its fullest. Thanks for reading!
We’ll discuss a new topic each week, so stay tuned. Drop your email address in the box below to get notified with each new post, or join our dedicated Slack channel to be a part of the discussion.
Next chapter: Mastering APM with Application Insights
Monitor your Azure environment, including VM, Functions, Cost and more.
SquaredUp has 60+ pre-built plugins for instant access to data.
Dashboard Story
Dashboard Story