Sameer Mhaisekar
Developer Advocate, SquaredUp


Join me on my Azure Monitor journey as I learn all there is to know about the platform. Check out my series introduction for a brief overview and a bit about me (tl;dr former SCOM admin, avid tech blogger, SquaredUp tech evangelist).
In our previous post, we discussed the question: 'What is Azure Monitor and how does it work?' and also covered the two types of data it stores, at a high level.
In this part, we will get ourselves started with Azure Monitor Logs. More specifically, we'll discuss how Logs are collected by Azure Monitor or, in other words, what options you have to add data sources to Azure Monitor so you can display that data in a way that makes sense to you. Parts 2 and 3 of this series will together cover the broad topic of “getting data into Azure Monitor Logs”.
There are a few different ways of getting data into Azure Monitor. It all depends on where the data is coming from and what purpose you need it for.
Executive summary
A quick disclaimer before we start… as part of Azure Monitor’s development, Microsoft has merged, updated or replaced a number of its components – and Azure Monitor Logs is one component that has seen a considerable amount of change and re-branding. Not that long ago, this post would have solely referenced Log Analytics rather than Azure Monitor Logs, so don’t get confused if you see one term or the other. In fact, Log Analytics is still a term used in the Azure Portal, but now it refers only to the tool you use to analyse and query your Logs. Azure Monitor Logs is the platform that does the heavy lifting, and Log Analytics is the operator console used to access and work with your data. Simple, right!
The first step to collect data is to set up a “Log Analytics workspace”. It is pretty quick and easy to do so:
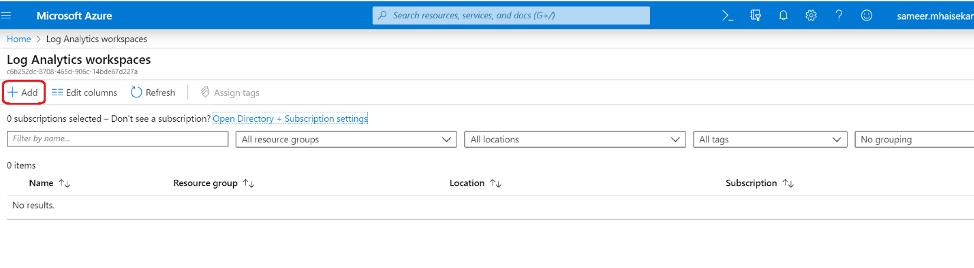
Search for “Log Analytics workspaces” in the global search box.
This will open up a window displaying your existing workspaces. To create a new one, click on the “Add” button on the top.
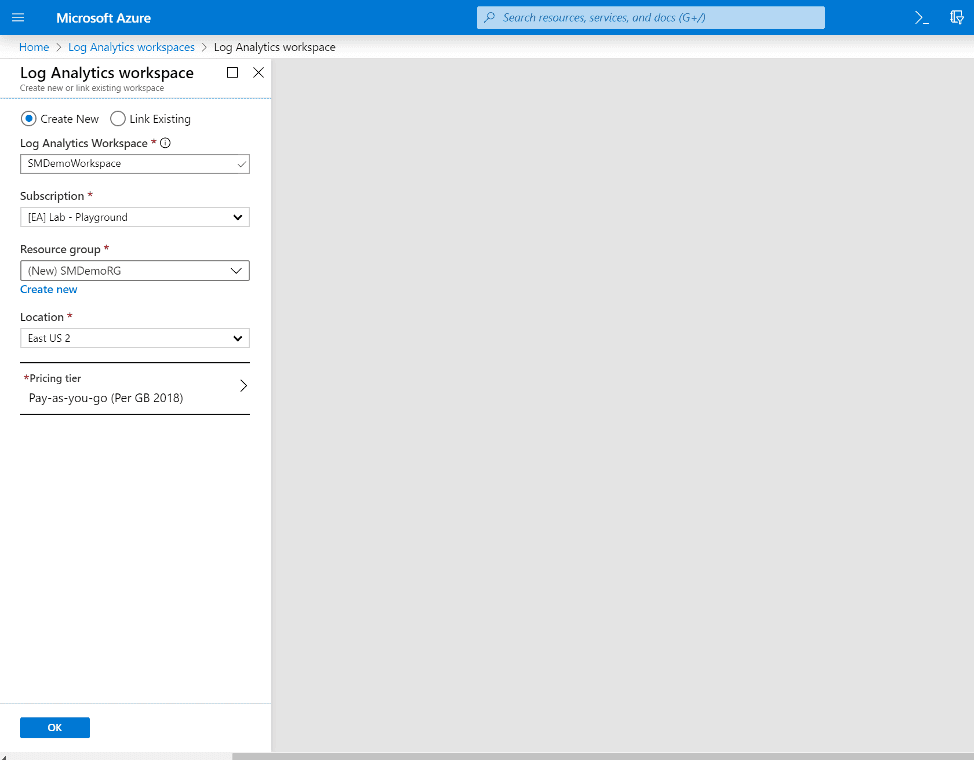
Fill in the required details and click OK. It may take a minute to deploy:
Once done, you’ll be presented with your new workspace. You’ll notice a workspace has all the usual options that you’d expect to see for an Azure resource such as the activity log, access management, tags, locks, the option to export the resource as an ARM template, and so on.
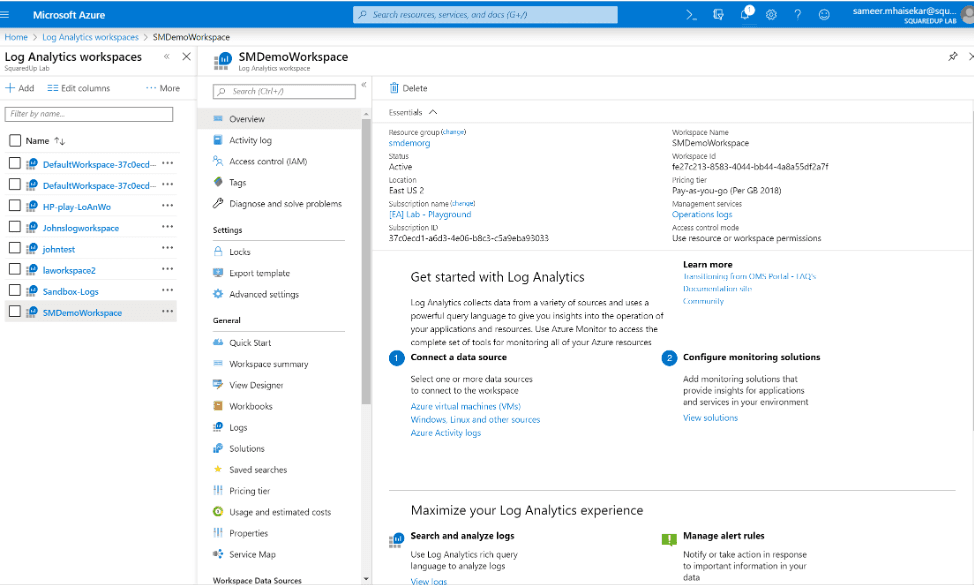
There are also some resource-specific operations such as the summary, Logs, Service Map, and Workspace data sources. We’ll dive into these in detail in upcoming posts but for now, let’s talk about the data sources.
With your new workspace set up, you can now start ingesting data which you can then query using KQL. Navigate to “Advanced Settings” under the “Settings” section from the menu and you’ll be presented with these options:
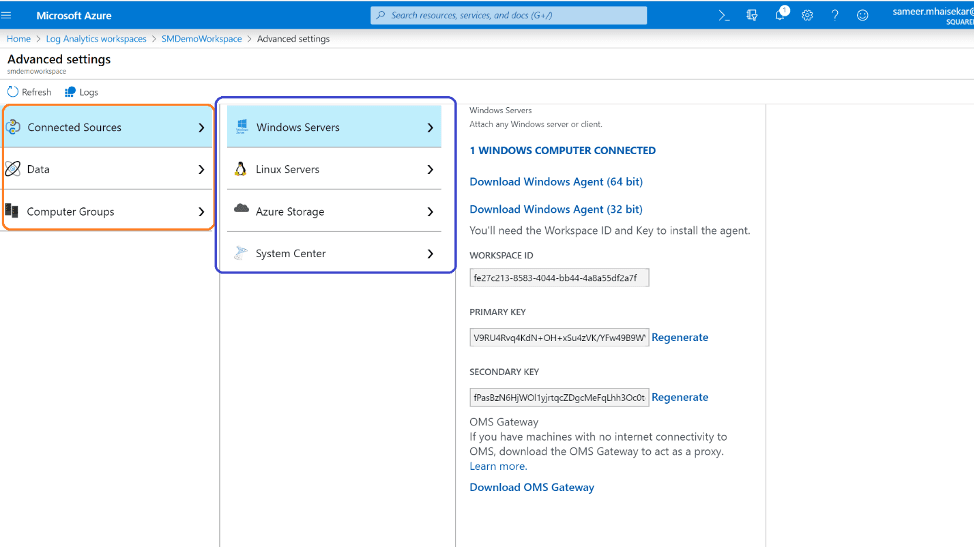
The left-most blade, marked by orange shows you which sources you’ve connected (Connected Sources), and what data you are collecting from those sources (Data). The computer groups option lets you create a group of computers from sources like Azure AD, SCCM collections, etc. You can then use these groups to filter the results of your query.
As you can see, I have one Windows Computer connected to this workspace. How did I do that? It’s fairly simple. Go back to the Workspace and look for “Workspace Data Sources”:
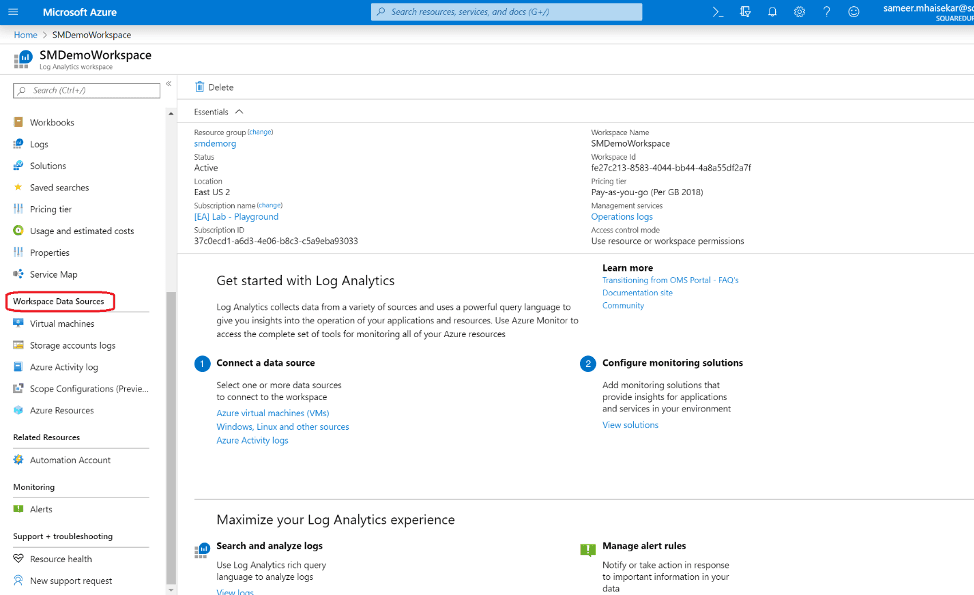
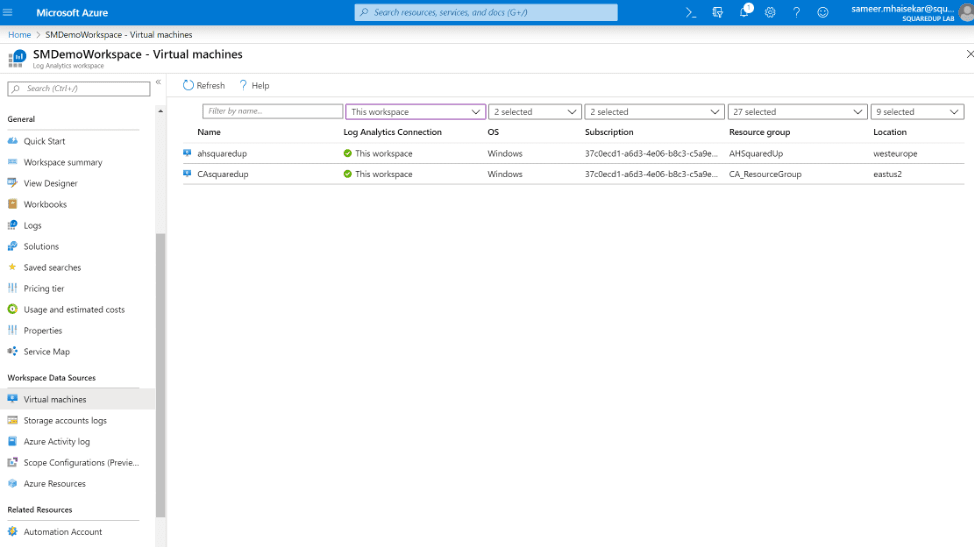
You’ll notice there are a few different data source types you can connect to your workspace, one of which is “Virtual Machines”:
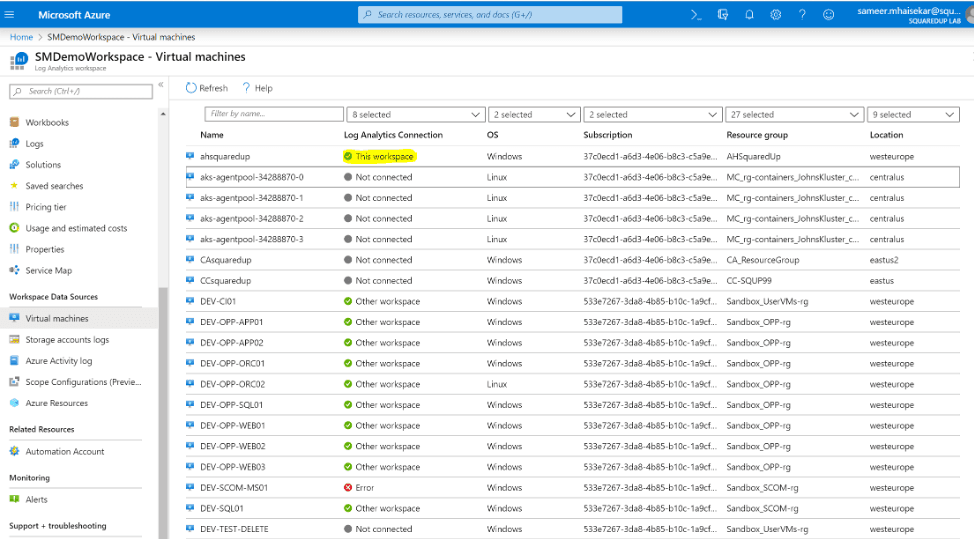
This blade will show you all of the virtual machines in your Azure tenant, and will indicate which Log Analytics workspace they’ve been connected to. You’ll notice that one of the VMs is connected to “This workspace”, some others are connected to other workspaces and some are not connected at all.
To connect a VM to a workspace, simply click on that VM and select “Connect”. In the background, the Log Analytics agent is being configured on your VM to send data to your new workspace. Note that the agent can only connect to one workspace at a time.
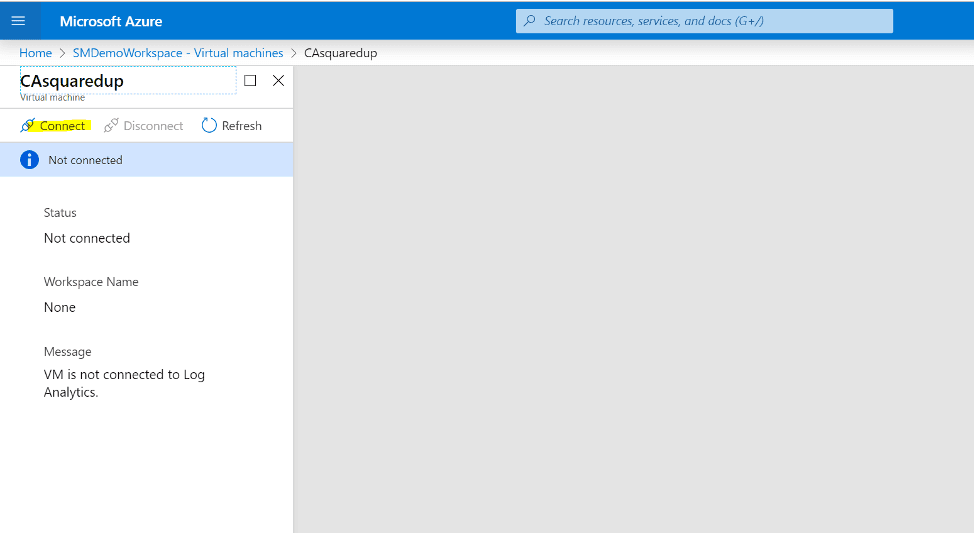
…and voila! You’ve now connected your VM to the workspace!
Note: There are also other ways you can connect your VMs to a workspace.
They include:
Connect Operations Manager to Azure Monitor
Setup and configure Log Analytics using SCOM
If you have a connected SCOM management group, this “extra” configuration will be delivered to the agents in the form of a management pack, in the interval of 5 minutes.
Once you’ve connected your VMs, you can now move on to choose what data you want to collect. Move back to the Advanced Settings and select “Data”:
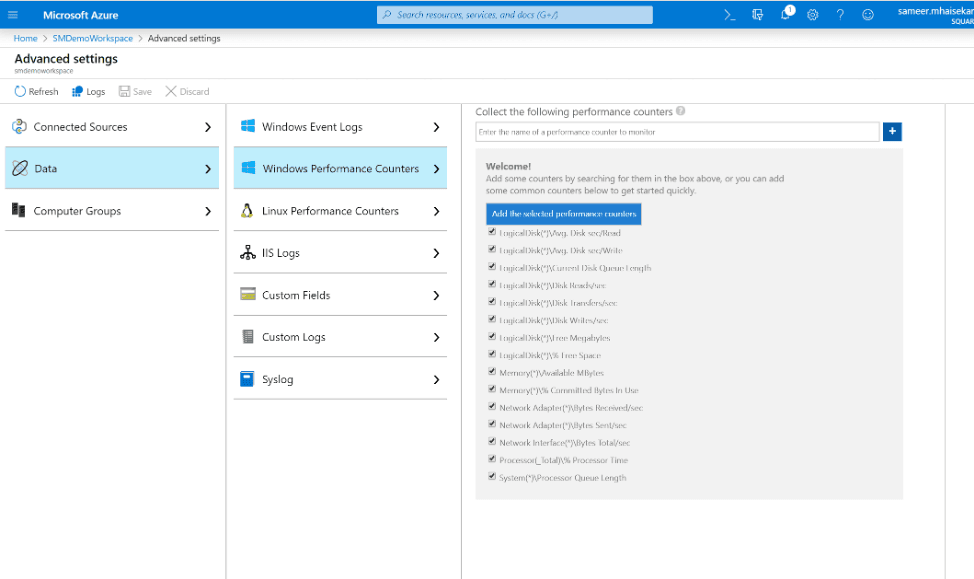
As you’ve probably noticed, you can select different sources from within the VM to collect the data from, like the event logs, performance counters, IIS logs, Syslog, etc. The data you’re collecting this way, is stored as logs and is available to query. Read Microsoft's guide on data sources.
VMs are not the only resource you can connect to your workspace though, and it’s likely that you have loads of other resources that you care about for your monitoring landscape.
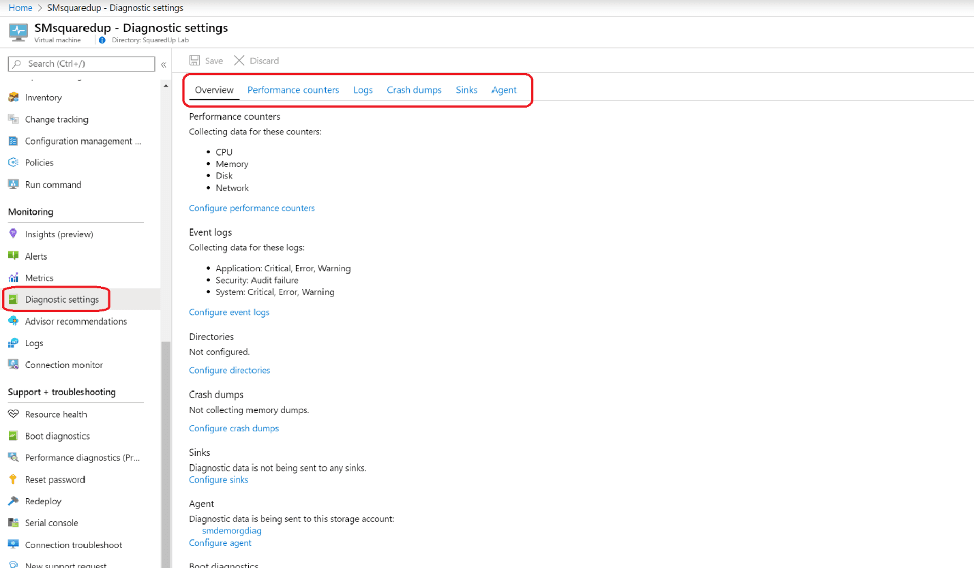
You can also collect some data into your storage accounts using the diagnostic settings. Diagnostics let you collect some platform logs and metrics, as well as some other important data such as sinks, crash dumps, etc. and store them into storage accounts, which you can then pour into your workspace.
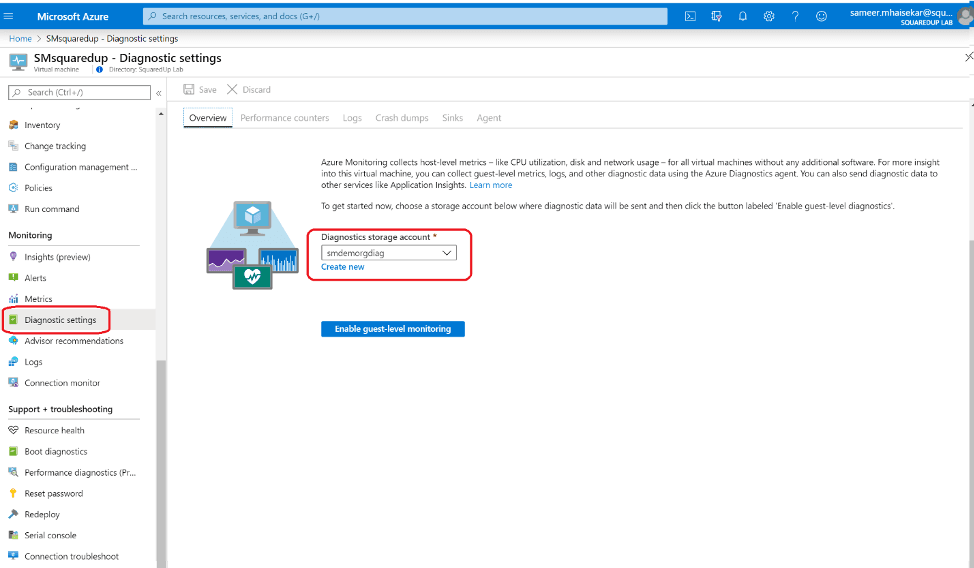
Select the storage account and click on the “Enable guest-level monitoring” option to start collecting some guest-level monitoring data. It’ll take a minute to finish and another to start collecting the data.
Once done, you should see a bunch of options for the data that’s now available to you.
Important thing to remember here is this is only valid for the Azure resources and not the on-prem ones. For the on-prem resources, you need to install the Log Analytics agent on them (linked above).
Now to connect this storage account to the workspace, from the “Workspace Data Sources” menu, choose “Storage accounts logs”:
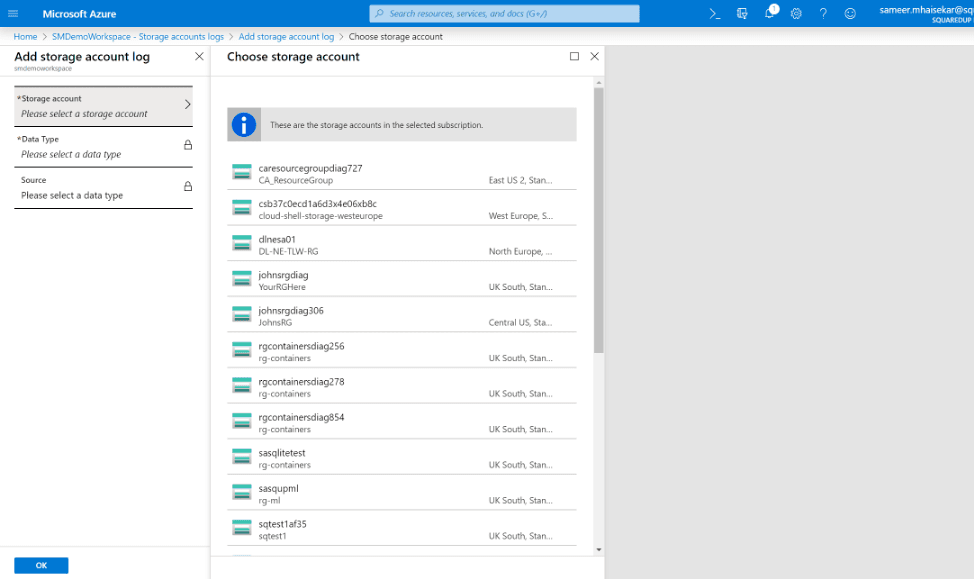
Select the Storage account, the data type (IIS logs, events, Syslog, etc.) and you’re good to go!
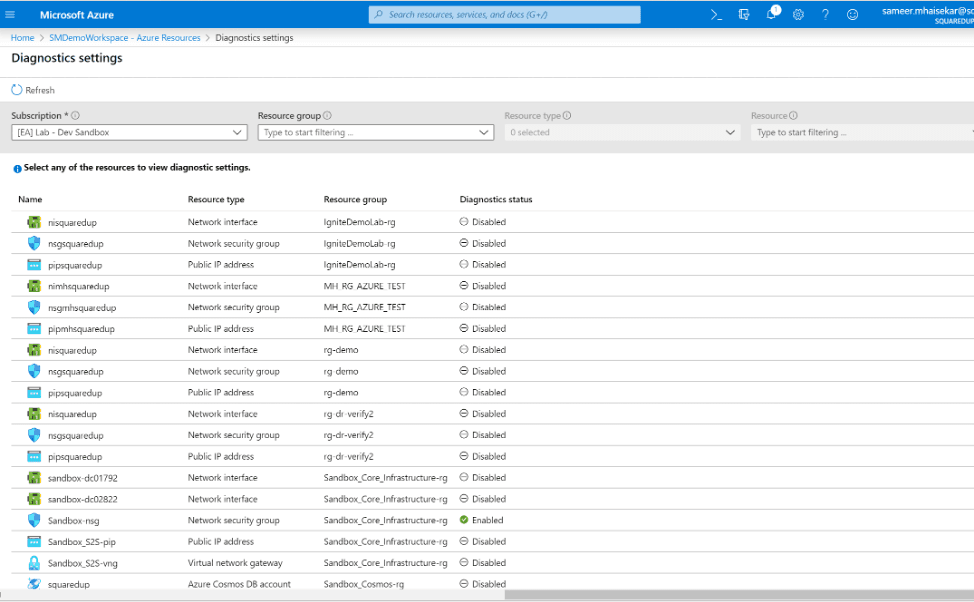
You can see which of your Azure resources have diagnostics enabled from the “Azure resources” view under “Workspace Data Sources”:
You can see what agents you’ve installed in your VM (diagnostics agent, log analytics agent, etc.) in the “Extensions” tab.
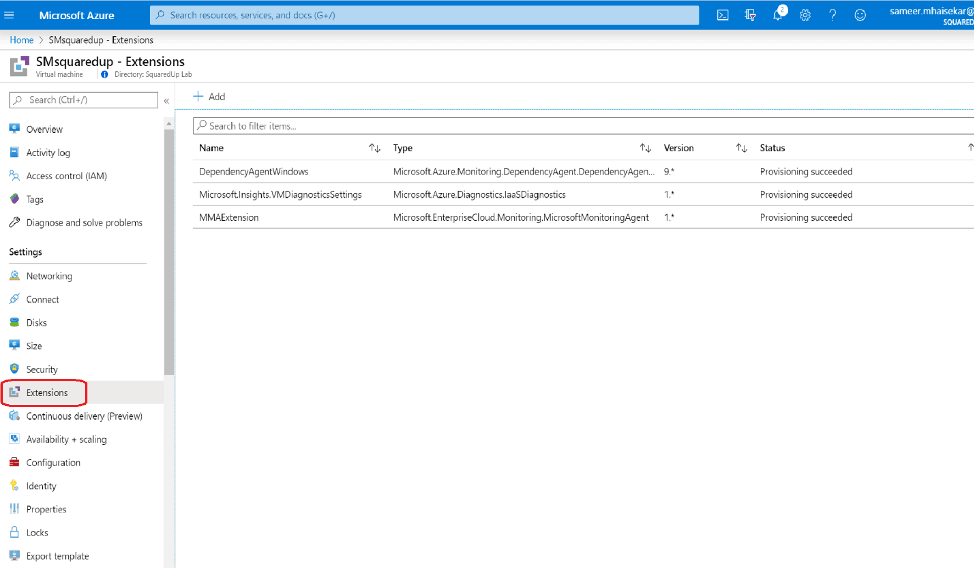
As you can see, we have the Diagnostics agent and the Log analytics agent installed on this VM. We also have a “dependency agent” installed on this, which is used for drawing Service maps. More on that later.
Microsoft documentation on Azure monitor agents
Microsoft documentation on service map
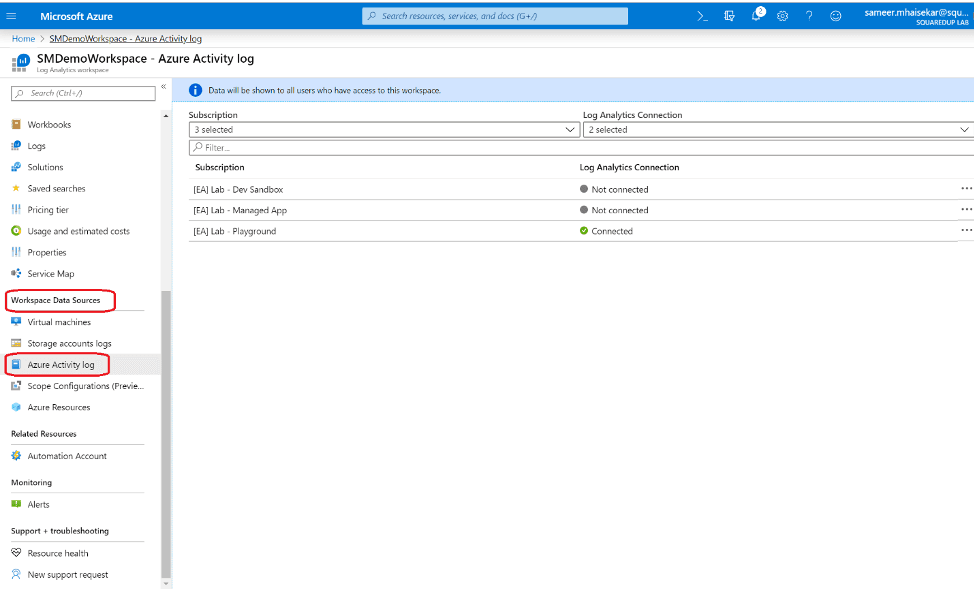
But that’s not all! Another type of really useful data you can collect is the “Activity Logs”. Activity logs record all the operations any users have performed against your Azure resources and are an excellent way to perform auditing. You can select the Activity logs you want to connect to the workspace based on subscription:
So now you’ve got your Log Analytics workspace and have set some resources to start sending data in. That’s all we’ll cover in this post—stage 2 of you journey toward becoming an Azure Monitor Superhero is complete!
“But why are we collecting all this juicy new data?” we hear you ask. Well, stick around to find out! Later in the series we’ll show you all the cool things you can do once you’ve got some data in your workspace.
Tune in to next week's blog to learn how to really leverage the power of Azure Monitor Logs—by enabling “Solutions”.
We’ll discuss a new topic each week, so stay tuned. Drop your email address in the box below to get notified with each new post, or join our dedicated Slack channel to be a part of the discussion.
Next chapter: Azure Monitor Logs—Solutions
Monitor your Azure environment, including VM, Functions, Cost and more.
SquaredUp has 60+ pre-built plugins for instant access to data.
Dashboard Story
Dashboard Story