Why SCOM needs SquaredUp: Performance monitoring reporting

As a SCOM admin, you’re probably heavily involved with alert analysis and performance monitoring. You probably also know then, that while SCOM is a great monitoring tool, it leaves a lot to be desired when it comes to reporting on performance monitoring.
I’ve got good news for you. SquaredUp sits on top of SCOM and completely changes the game. How? Why? Read on for a comparison and break down of all the reasons you should do it with SquaredUp.
Reporting on performance monitoring: SCOM vs SquaredUp.
SCOM
Within the SCOM console, there isn’t much you can do to report on performance monitoring aside from creating a few performance views. And that’s not a particularly enjoyable experience either. Let’s take a closer look.
Firstly, the only visualization option you get is the line graph, which unfortunately isn’t always the best fit for all performance counters. Secondly, the scoping criteria is not as flexible as it should be.
Here’s an example of a dashboard reporting on CPU utilization, logical disk free space, health service utilization and memory:

It’s a simple report, and there is nothing else you can do about this from here, no drilldowns. Another major flaw is that this is all view-only.
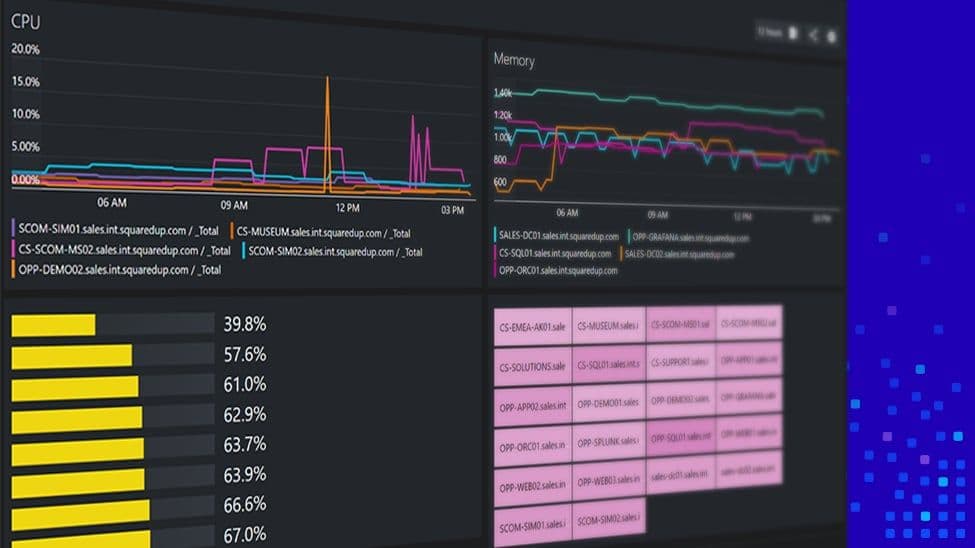
Now, this is the equivalent in SquaredUp.

Like what you see? Let’s break it down.
SquaredUp
Many visualization options
The first thing you’d notice when creating a performance monitoring dashboard in SquaredUp is the range of visualization options you have available.

As you can imagine, some of these go quite well with certain counters. For example, a Bar Top N would work well for logical disk space, a line graph would work best for something like CPU utilization, and a Scalar value would work the best if you wanted to know the last recorded value of a counter, etc.
There is also an advanced criteria option which allows you to narrow down the results to the specific data you want, which also can contain wildcard matching.
So after adding a couple of tiles, you’ll have something that looks like what we showed you above. All in a matter of a few clicks!

Easy drilldowns
This is not only better on the eyes – it is also highly actionable.
You can drill down into any of these individual objects simply by clicking on it within the tile.

Note the sections in the red boxes. On the top you’ll see the complete path of the object that you just drilled into. You can switch between all levels of the path there to gather more information about the object itself.
Below that, you’ll notice different timeframes. With a single click you can flick over to a different length if time, all loaded in a matter of seconds.
This easily accessible, insightful data gives you the full picture of every object, and helps you easily get to the root cause of problems that occur.
Compare multiple objects
You can get even more valuable insight by comparing multiple objects, using the Compare button on the right.
As the name suggests, it lets you compare the behaviour of a specific counter across multiple objects.

Export to Excel
Adjacent to the compare button, there’s also an export button. Clicking it will export this exact graph along with the individual data points into an Excel sheet, for ease of access, distribution and analysis.
Pull data from any SQL database
Another thing related to performance reporting is the SQL tile.
As you already know, all this performance data is coming from the Data Warehouse. You have the performance collection rules to collect the counters, but what if the data you want to see is in the database but not easily accessible? SquaredUp’s SQL tile comes to the rescue!

Using the SQL tile you can simply write your custom SQL queries and run it on any SQL database.
All you have to do is connect to the database using a connection string and you’re done. Here’s an example of what you can do with a SQL tile. A quick Alerts Report:

Everything you see here has been extracted with a SQL query. Isn’t that awesome!
Now, reporting on performance monitoring is only one of the many amazing things you can do with SquaredUp.
Learn how you can reduce monitoring silos across teams and elevate your SCOM monitoring. If you’d like to see how exactly SquaredUp can work for you, take out a 30-day free trial using the form below or book an introductory call with one of technical team.
