- Share application status with the Business

- Communicate with Service Status Messaging

- Monitor your Network with Link Dependency Monitoring

- Set up Availability Monitoring from the end-user's perspective

- How to automatically map your applications and easily fix server issues

- Share dashboards with the business

Share application status with the Business

Once your monitoring is operational for a while, it becomes evident that infrastructure monitoring alone is not enough. Sure, SCOM is excellent when focused on an infrastructure level problem. Do you have an alert that your Windows server is running out of space? Check. Can you check to see if your SQL Server has had a lot of deadlocking recently? Check. Do you know if your Linux server is out of swap space? Can you report on how fast it has been running out? Check. But can you tell your CIO that the old server sitting in the corner of your machine room rebooted and half of your enterprise applications just went offline? No?
Did you know that SquaredUp has an "easy button" for that? It's called Enterprise Application Monitoring (EAM).
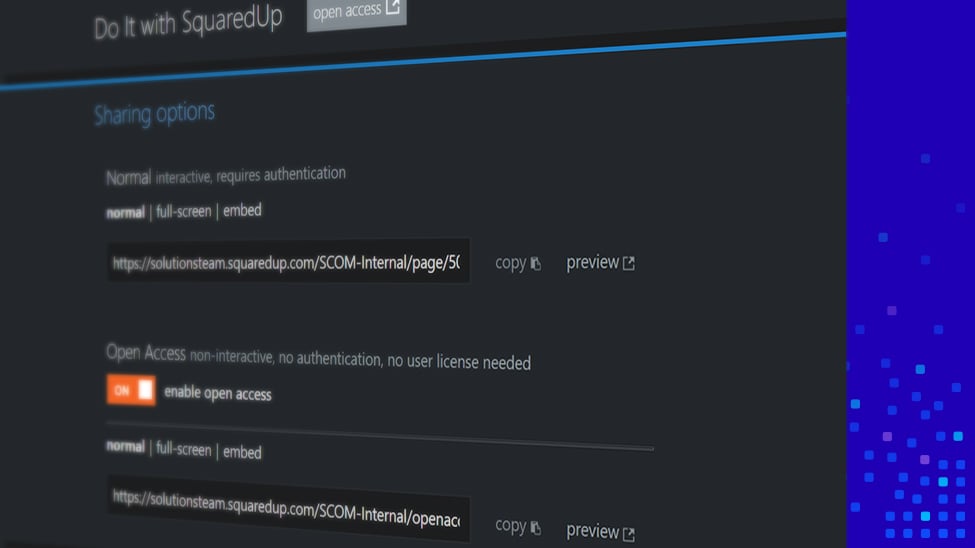
With SquaredUp's EAM edition, you can quickly create stunning dashboards to communicate your enterprise application's status swiftly. No infrastructure monitoring is needed, but if you have it, why not put it to use? With Link Dependency Monitoring, you can quickly add TCP monitoring to validate that the network is working. How about setting up a quick test to validate that your application works from the customers' perspective? Check out SquaredUp's Availability Monitoring feature. Remember that server in the corner? Do you know who it's talking to? Using SquaredUp's Visual Application Discovery and Analysis (VADA) feature, you can easily see who is talking to it. You can also add it as a dependency to your application so that you will know when it fails. Lastly, with Open Access, you can broadly share your dashboards to every level of your organization or on the smart refrigerator in the break room, or wherever you need them!
This five-part series will look at how SquaredUp helps you:
- Communicate with Service Status Messaging
- Monitor your network with Link Dependency Monitoring
- Set up Availability Monitoring from the End Users Perspective
- Visual Application Discovery and Analysis (VADA)
- Share dashboards Open Access
Here are some teaser screen captures for this upcoming series:

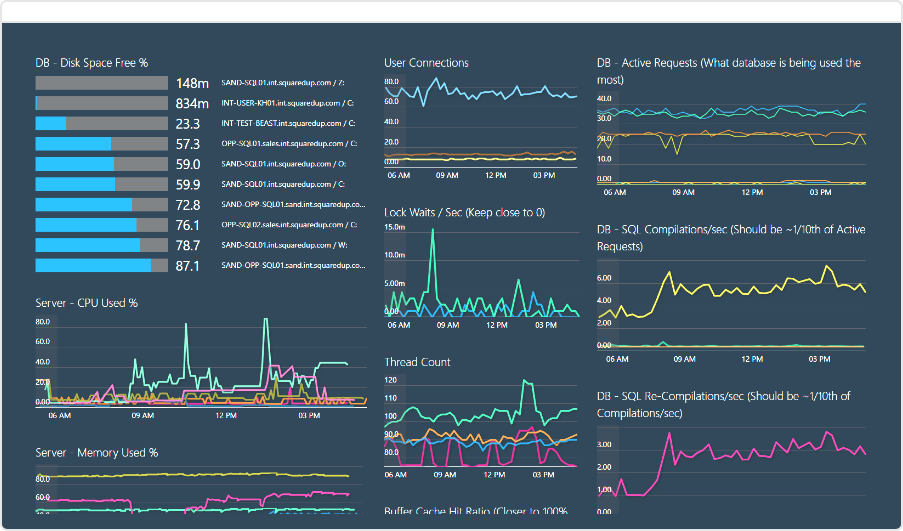
The Enterprise Application Status dashboard is an excellent dashboard to use when you want to communicate swiftly without revealing too much of the underlying infrastructure.

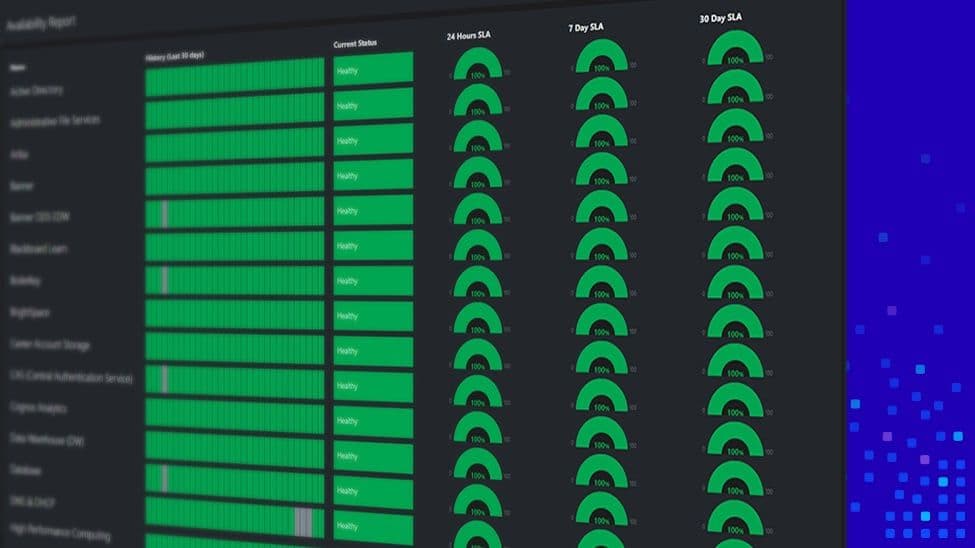
The Enterprise Application SLA dashboard is your peek into your service levels for any given application. These service levels can track something as simple as manually changing the state to tracking your infrastructure automatically.

The Enterprise Application Visual Application Discovery and Analysis (VADA) dashboard is the missing piece to your application puzzle. When you put your infrastructure into a VADA diagram, you get instant visibility across your servers to spot any problem areas.

And finally is the Enterprise Application Availability monitor dashboard that is your early warning system. When organizations talk about being proactive, this is the dashboard they wish they had! A ready-made framework to capture data from the customers' perspective.
Like what you see? This is not all. Learn how to elevate your SCOM monitoring with SquaredUp from upgrading your SCOM console to heavily reducing monitoring silos.
If you'd like to see how exactly SquaredUp can work for you, take out a 30-day free trial using the form below or book an introductory call with one of our technical team.
