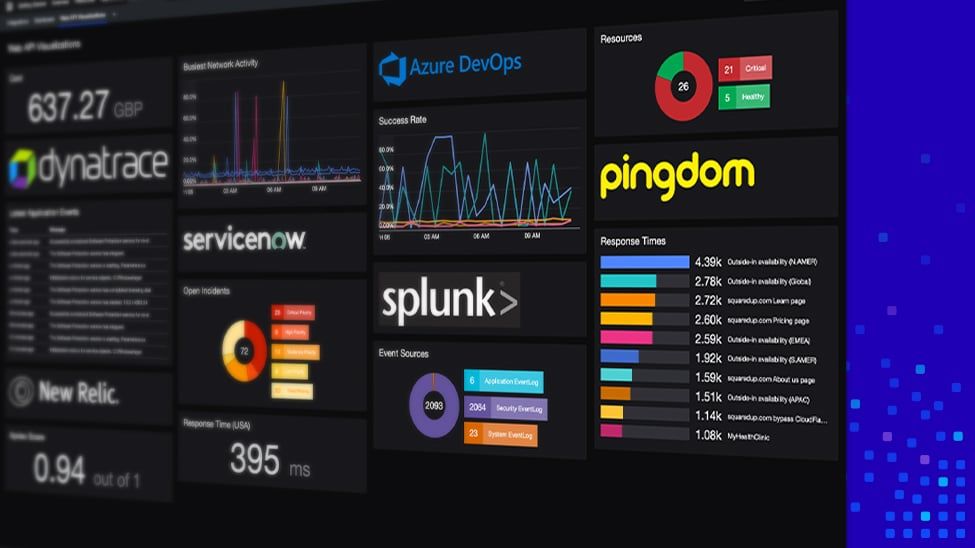
Reduce monitoring silos with SquaredUp WebAPI and SQL tiles

SCOM is a great solution to monitor your infrastructure. Everything you need for in-depth monitoring is provided out-of-box or with a dedicated management pack. If your organization is genuinely invested with SCOM, you probably also know that you can get in-depth monitoring with SCOM’s Application Performance Monitoring (APM) functionality, and collect events across your servers with SCOM’s Audit Collection Services (ACS). But as most monitoring teams have figured out, their organizations grow organically and at radically different paces. When you consider that you may have already deployed Splunk, Dynatrace, Azure DevOps, Pager Duty, Pingdom, Servicenow, etc., you start to realize that bringing all of this information together can be a daunting task.
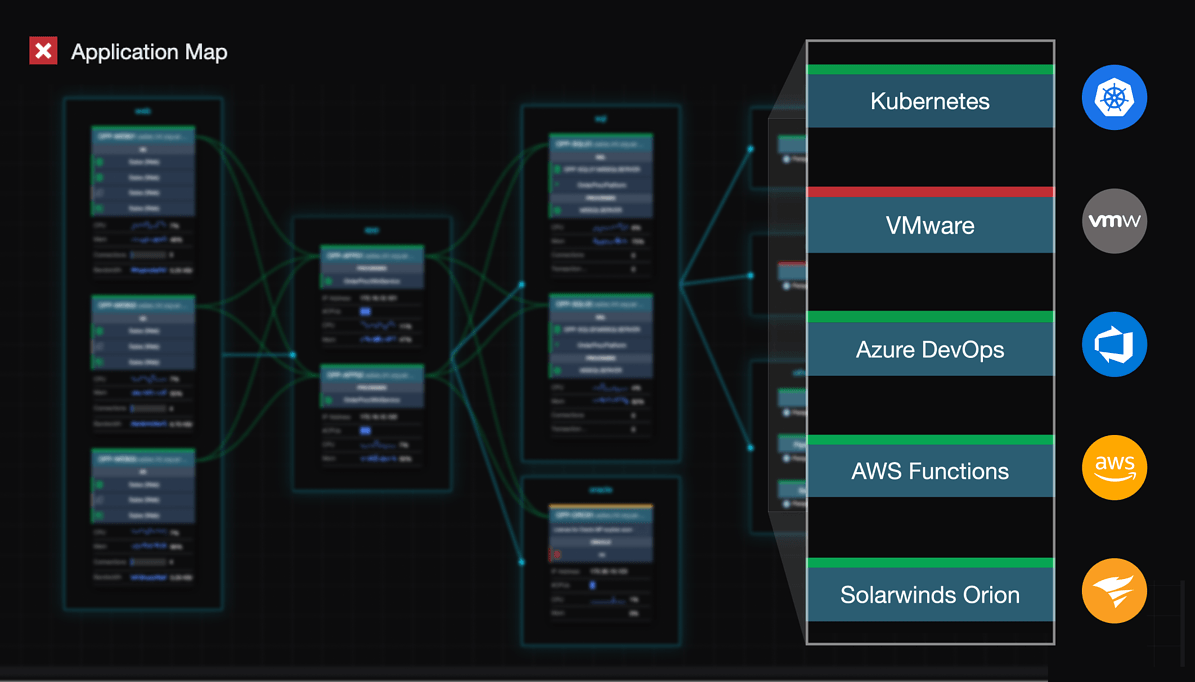
But if you have SquaredUp for SCOM at the center of your monitoring initiative, you have cross-platform, silo-busting visibility into each of your applications.

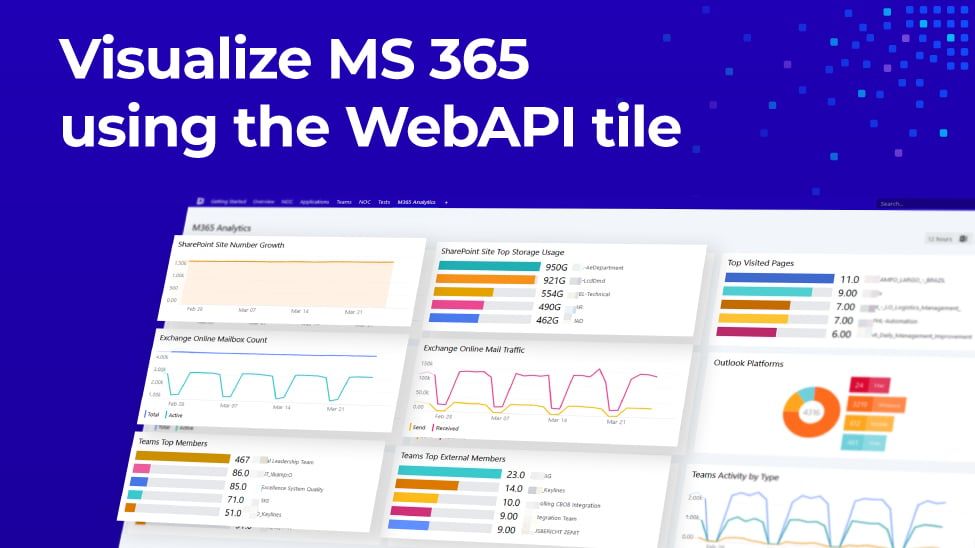
How? SquaredUp’s SQL, Web API, and Web Content tiles allow you to pull data from external data sources and display them natively in a dashboard. That means you can present a singular source of truth to your users, from multiple data sources, in real-time!
Pingdom, New Relic, SQL, SCOM – all on the same dashboard
Let’s assume that you invested in Pingdom’s Synthetic Monitoring for your public-facing applications. With Pingdom, you know your applications are operational from the customers’ perspective. But internally, you are also running New Relic as your APM tool, which gives you insight into each transaction as it travels across your servers. Finally, you have SCOM monitoring each of your servers to make sure the necessary resources are available. That’s three different applications providing insight into your application!
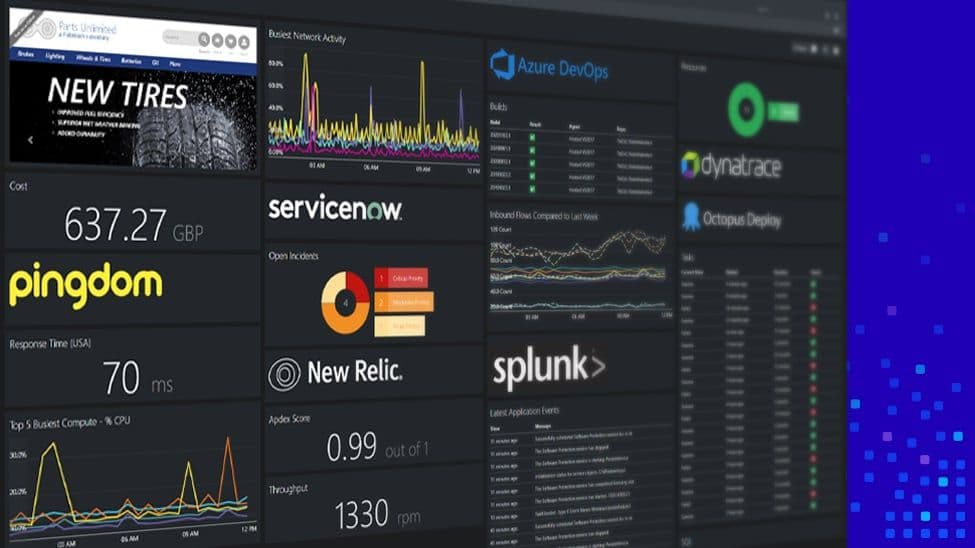
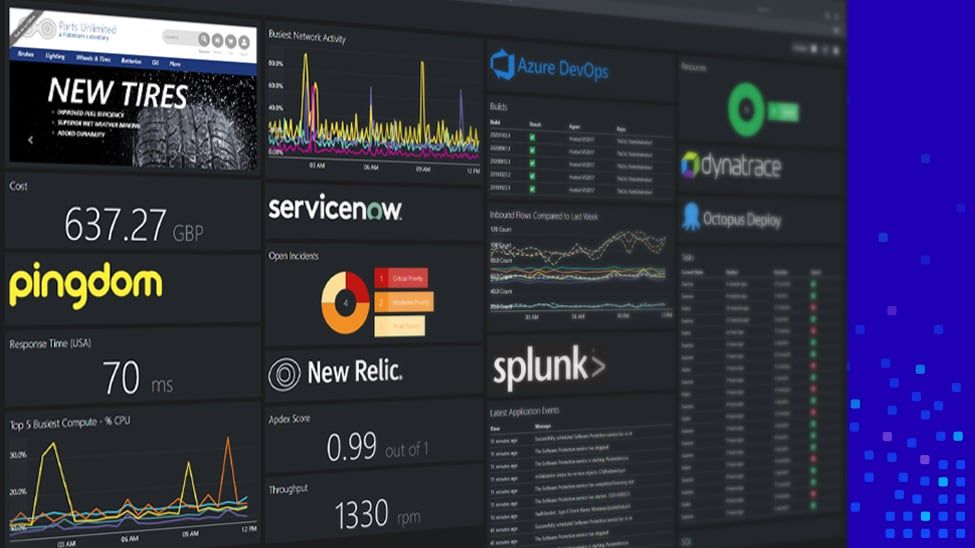
But here’s how it looks on one dashboard:

Breaking it down, Pingdom allows you to pull data via a RestAPI. New Relic enables the sharing of graphs via webhook. And we can present SQL Server data in some unique and exciting ways with the SQL line Graph tile.

Now you really can have it all.
