Vincent Babin
Senior Product Manager, SquaredUp
Senior Product Manager, SquaredUp
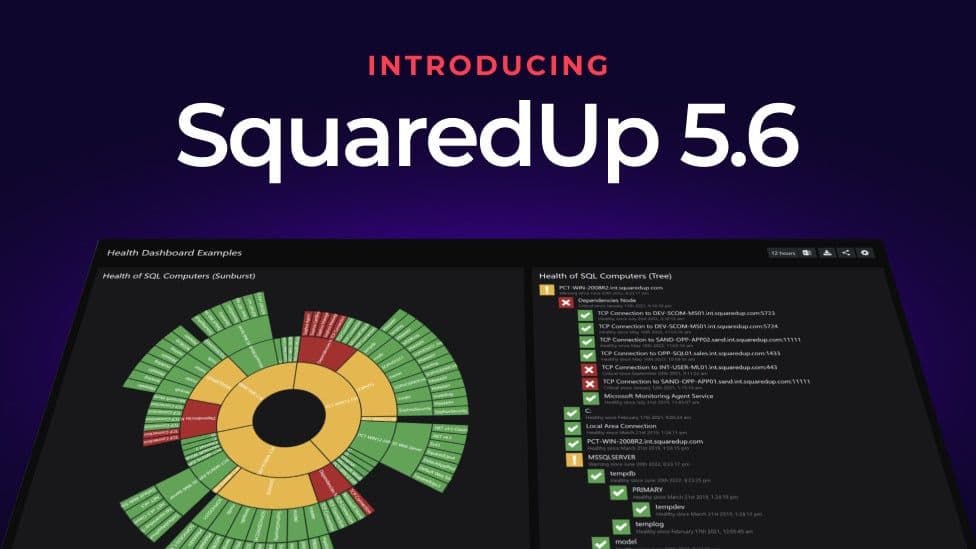
We’re excited to announce that we’ve just released SquaredUp Dashboard Server 5.6!
This Dashboard Server release covers multiple features that have been highly requested by the community. Prioritizing this user feedback, we’ve added some exciting new visualizations, features and enhancements.
Read on to learn about the latest updates, or catch the full webinar recording at the bottom of the blog for a detailed demo by Senior Solutions Engineer Ashley Thompson.
The first new visualization we’ve introduced is the Tree View tile.
The Tree View tile lets you see the hierarchy and health status of your SCOM objects at a glance.
You are now able to take quick actions like drilling down with one click directly to the component that's causing a problem.
This is especially useful when you need clarity during root cause analysis. The tile can be scoped to any SCOM object and will display all its children. Additional display options allow you to filter on health states and choose the appropriate tree depth for your use case.
More details on how to use the Status Tree View tile
The second new visualization is the Sunburst tile.
The Sunburst tile allows you visualize your SCOM objects in a unique way—offering a visual representation of both the status of and the relationships between objects.
Here's a quick walkthrough of how you might use it. Start by taking a quick glance at the inner circle of the Sunburst, which represents the highest-level views of your environment. Then work your way out to the outermost circle that represents the lowest level component that could be causing the problem.
Spinning the Sunburst with your mouse gives you a clear view of all the labels regardless of their orientation, and the additional display options allow you to customize the look and feel of the tile.
When paired with EAM-X, the Sunburst tile enables you to explore all your single pane of glass objects from our SquaredUp observability portal plugins. It is easy to navigate, and you can drilldown with a single click for root cause analysis.
More details on how to use the Status Sunburst tile
One of the most popular tiles in SquaredUp is the Status tile. The status tile now supports TOP N so you can limit the number of objects that are displayed, offering you more focus and ensuring your dashboards look consistent.

We have also added the ability to wrap the labels so you can further optimize the display of this critical tile.
The SCOM Monitor tile now also benefits from the TOP N functionality, as well as the ability to sort by health states.

Check out the release notes to find out more about these features and other improvements.
Watch this full demo by Senior Solutions Engineer Ashley Thompson for a detailed walkthrough of the improvements within SquaredUp Dashboard Server 5.6.
Upgrade to SquaredUp Dashboard Server 5.6 by downloading the edition you need from download.squaredup.com
And don’t forget about the community dashboards. You can find dashboards that others have already built and get the code from our Dashboard Gallery. You can also contribute your own dashboards and get a chance to win LEGO prizes.
Happy Dashboarding!
Senior Product Manager, SquaredUp