Graham Davies
Technical Product Manager – SCOM products
Thinking in Services, Not Alerts
Technical Product Manager – SCOM products
Series: The State of SCOM in 2026 — Part 6
By this point in the series, the decision is made, the platform's proven itself, the override debt is cleaned up, and the migration is done. You're on a clean, well-tuned SCOM 2025 environment. What do you actually have?
If the answer is "a console with a few hundred alerts in it," the migration worked, but the value didn't land yet.
It's the question that opens almost every major incident call, and it's revealing: it means nobody in the room actually knew the state of the estate before something broke. Open the SCOM console on any given morning and it's easy to see why. Hundreds of alerts. Some critical, most not, plenty that will never get looked at. Nothing tells you which one represents a real business impact and which is noise from an undertuned management pack.
The problem was never that SCOM isn't monitoring — it plainly is, that's what generated the alerts in the first place. The problem is that a list of alerts has no business context attached to it. Is a given alert a performance blip on a test box, or is it the one system a clinical or trading team is relying on right now? The console alone can't tell you, and that gap is exactly what turns a five-minute fix into a scope-finding phone call.
The shift that actually closes that gap is a simple reordering: instead of starting from an alert and working out what it means, start from the business service and let alerts flow into it.
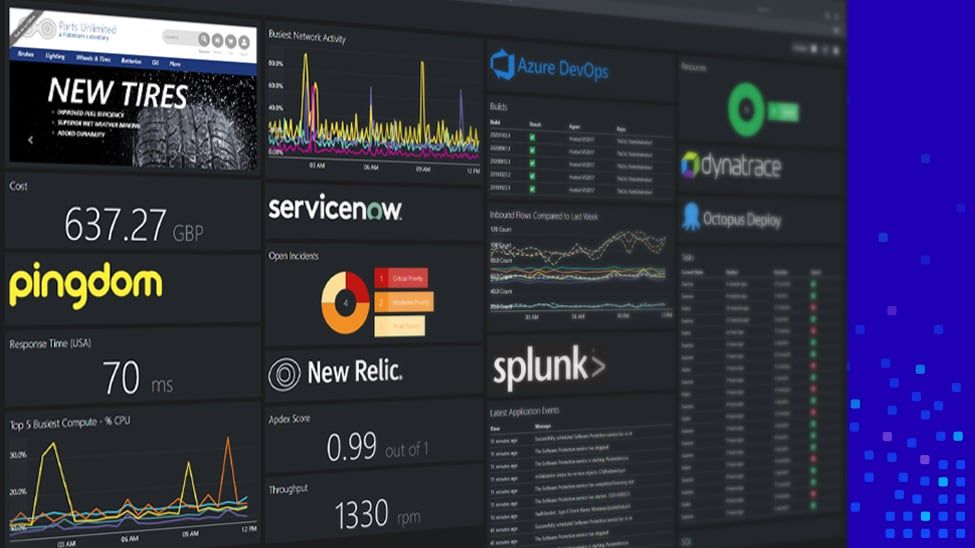
Every service — a clinical system, a trading platform, a customer-facing application, along with the infrastructure underneath it — gets mapped as a single visual tile. Green means healthy. That's a view a service owner can glance at every morning, one an IT director can put in front of the board, and it's live proof that SCOM is doing its job and the business is running.
This isn't a replacement for SCOM. It's what makes SCOM's monitoring data visible to everyone who needs it, not just the handful of engineers who already know where to look in the console.
Here's where the model earns its keep. Something goes wrong, SCOM detects it — and instead of firing an alert into a queue of hundreds of others, a single tile turns red.
The value isn't just that one tile is red. It's everything around it that's still green. A service owner can tell, at a glance, that this is an isolated problem in one part of the estate, not a wider outage. The rest of the dependency chain — other clinical systems, other applications, the infrastructure layer — is unaffected. That context is completely absent from a raw alert list, and it's the difference between an isolated fix and a full incident bridge call trying to establish scope from scratch.
Monitoring told you something broke. Service-level context tells you how much it matters.
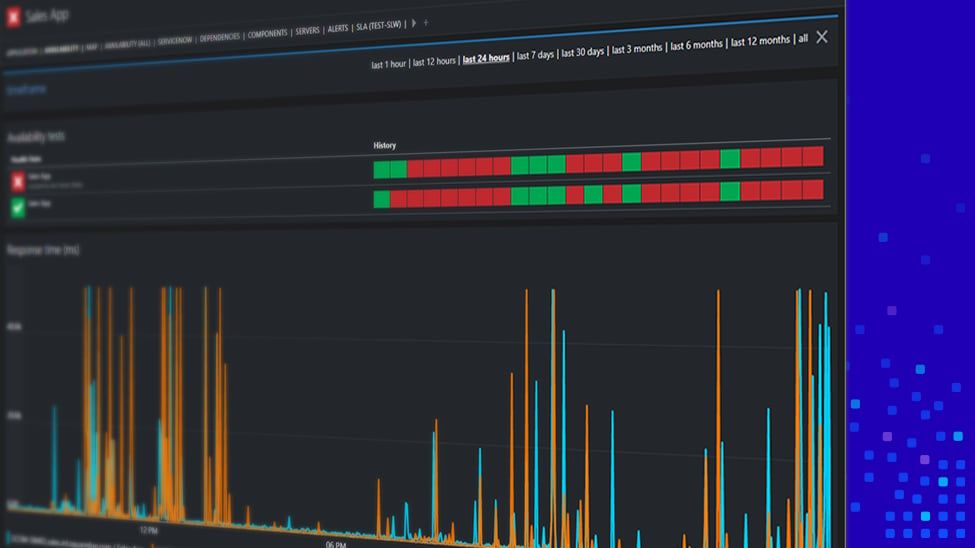
From there, the workflow gets specific fast. Drill into the red tile and you land on the component that's actually failing, along with an alerts heatmap showing when the problem started and exactly which open alerts are driving the red status.
That's a meaningfully different starting point than "this system is broken." It's "this specific component within this specific service is generating this specific alert" — with the surrounding components confirmed healthy, so you know immediately what isn't the problem. Without that layer, finding this would mean already knowing which system to look for in the console, filtering the alert view, and working out which of several hundred alerts is actually relevant. With it, it's a couple of clicks from a single overview screen.
Click through again and you get the full alert detail enriched with service context — description, ownership, the team responsible, and everything SCOM captured at the time. From there you can act without leaving the view: assign it, log a ticket reference, update the state, add a note. All grounded in SCOM's own data, just organized around what the business actually cares about.
Once the underlying issue is resolved, SCOM detects the recovery and the tile goes back to green immediately. That's the whole loop: a service owner has a live, accurate picture of the estate's health at every point in the cycle, not just when something is on fire.
Monitoring tells you something is wrong. Turning that monitoring data into service-level operational intelligence tells you what to do about it — and that's the payoff for everything covered earlier in this series. The SCOM MI retirement forced a decision. UR1 and a clean migration meant you landed on a platform worth trusting, without a decade of alert noise. And service-based dashboarding is what turns that clean, well-tuned SCOM estate into something the whole organization can actually use — not just the team that knows the console.
One question remains, and it's the one people usually ask right after they've seen a service-level dashboard for the first time: which tool do you actually build this on? That's where we finish the series.
---
Next in this series: Buy vs. Build — Choosing a Dashboard Layer for Your SCOM Data
Technical Product Manager – SCOM products