New release: Dashboard Server 5.7 is here
The newly released SquaredUp Dashboard Server 5.7 is packed with new features and functions that will not only help you visualize your data better but also let you report on and analyse your metrics more easily.
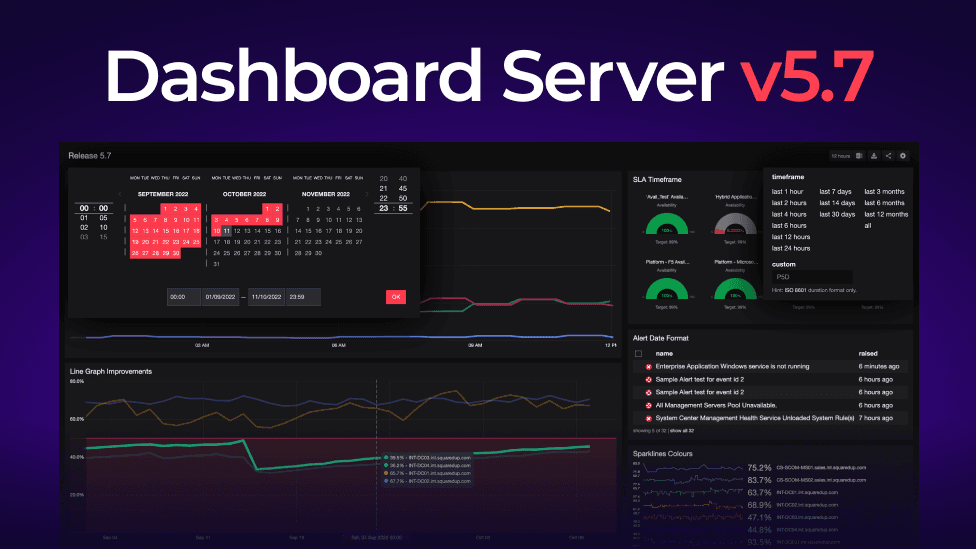
Here’s a quick overview of all the new features:
- Custom, flexible timeframes for more reporting and analytical capabilities
- Thresholds on graphs to easily see out-of-bound metrics
- Future metrics visible on line graphs for forecasting
- Drilldowns on all objects simultaneously in a line graph
- New hover panels for line graphs so you can see more data details at a glance
- A recycle bin for all your dashboards and perspectives so you can restore at any time

Catch the full release webinar recording at the bottom of the blog for a detailed demo by Vincent Babin, Senior Product Manager at SquaredUp.
Here's what's new in SquaredUp 5.7...
Compare more timeframes easily for more context
There are now more timeframe options for your tiles and dashboards, like the 14-day timeframe, as well as a new custom option so you can choose any duration you want using the ISO8601 format. This gives you a lot more flexibility to compare timeframes for analysis and reporting. You can set any of these timeframes as the default for your dashboard and switch between them easily.
You can compare timeframes side-by-side by duplicating a performance, alert, or SLA tile and changing the default timeframe on the duplicated tile.

There’s also a new calendar date picker available in most tiles, like the performance, SLA, and alert tiles, to make this even easier to set up.

You can do all this with SQL scripts too. The timeframe picker will show the variables that you can insert into a SQL script.

The additional timeframe features are particularly useful for when you want to compare SLAs and gain context over whether changes are normal within different durations. They’re also great for reporting and analytics to stakeholders. You can set up a weekly dashboard to review performance history, for example.
All this gives you more context, insights, and greater flexibility.
You can see timeframes in action in this demo video:
Find more technical details on using timeframes here.
See out-of-bound metrics on line graphs with thresholds

The new threshold feature in 5.7 lets you set an upper or lower threshold for any metric on a line graph. That will then display a line and a red area of concern so you can identify out of bound metrics at a glance. No more hovering over lines to see metric details to identify whether they’re near your thresholds.

You can easily set upper and lower thresholds using the threshold picker in the tile settings.

Combine adding a threshold with varying your timeframes and you get even deeper insights into usage and performance so you can take action – like decreasing usage or increasing capacity – if there are spikes or dips into the area of concern.
Find more information on setting thresholds here.
Drill down on all objects in a line graph at once

Instead of drilling down on one line in the line graph at a time, 5.7 lets you click any area on the line graph and it will take you to a drilldown that shows all the objects. You can see all the lines and even the threshold so you have everything in one place without having to add servers for comparison. As before, you can still add more servers if you want to compare more objects in the drilldown.
You can also see here the new hover panel that shows all the metrics, colour coded, in one place for easy reading of the metrics.
See dates in the future for forecasting
The new ability to see future dates on line graphs lets you input future data. This is ideal for capacity planning. Maybe you had a script for capacity planning and forecasting usage, or you have future data in an SQL database or from a management pack, now you can see it displayed in SquaredUp line graphs.

Sparkline colour labels now match
A small but noticeable improvement for our line graphs in 5.7 is label colour matching on sparklines. Sparklines will now match the colours of the same object displayed on another tile.


Here's a 5-minute video of all the SquaredUp 5.7 line graph enhancements.
Recover deleted items easily from the Recycle Bin
Finally, we have added an all-new feature – the Recycle Bin. If you delete a dashboard or perspective, it will automatically go to the Recycle Bin. From there, you can restore anything you need available again or permanently delete items. (Note that only admins can restore and delete items.) Being able to restore perspectives is particularly helpful as they are often more complex to rebuild.

You also get visibility of who deleted what and when, so you can ask someone why they deleted a dashboard or perspective if you need more clarity.
Watch a quick demo of the recycle bin here:
Those are all the best new features and improvements in SquaredUp Dashboard Server 5.7. You can always check out the release notes to find out more about these features and other improvements.
Watch the full 5.7 demo
Watch this full demo by Vincent, our Senior Product Manager, for a detailed walkthrough of the new features and improvements in SquaredUp Dashboard Server 5.7.
Get SquaredUp Dashboard Server 5.7 and try it yourself
Try out the new features for yourself! You can download the latest version of SquaredUp Dashboard Server here.
For a step-by-step guide on how to update your Dashboard Server SCOM Edition deployment to the latest version, see How to upgrade Dashboard Server SCOM Edition.
To get started with SquaredUp Dashboard Server, see How to install Dashboard Server SCOM Edition.
Have you seen the new SquaredUp Cloud product?
If all that hasn’t been enough, we’ve also released a brand new product – SquaredUp Cloud! If your center of monitoring is shifting away from SCOM, SquaredUp Cloud may be exactly what you need.
It’s a tool-agnostic observability platform for all your cloud, DevOps, and Product tools. Think of it as BI for engineering teams.
Find out more in this blog post: Introducing SquaredUp Cloud
SquaredUp Cloud and Dashboard Server Road Map
We still have lots more planned for Dashboard Server too.
Watch this overview of SquaredUp Cloud and the road map of everything that's in the pipeline to help you continue getting the most out of SCOM (including the already available Dashboard Server EAM-X, which lets you harness some of the amazing powers of SquaredUp Cloud integrations from within Dashboard Server).
Happy dashboarding!