Vincent Babin
Senior Product Manager, SquaredUp


Senior Product Manager, SquaredUp
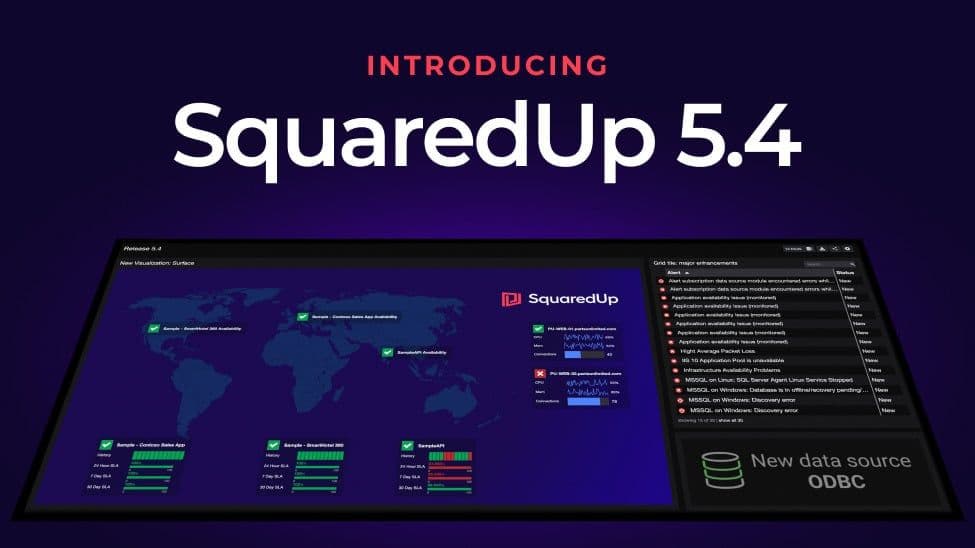
SquaredUp 5.4 is here and it’s got some brilliant new features and upgrades to help you troubleshoot and find answers faster than ever.
You’ll find the upgrades across all three SquaredUp editions – for SCOM, Azure, and the free Community Edition.
Here are the highlights in the new release:
Check out our release webinar for a detailed walkthrough and demo.
We've added ODBC as a new data source to SquaredUp 5.4
Bring data into SquaredUp from any ODBC compliant database, like Oracle, PostgreSQL, MySQL and more so you can surface more insights. You also get re-usable connection strings.
Unlike other dashboarding platforms SquaredUp Dashboard Server has no programming or complex setup required. Just set up your connection, enter your SQL query, and go!
You can now administrate all your connections in one place for all your tiles across all your dashboards. And you don’t even need to log in to the Windows box to configure your ODBC source, you can do everything through SquaredUp.
Almost everyone using SquaredUp uses the grid tiles. Although they’re not the most glamorous visualization, this is the ideal format for monitoring SCOM alerts or displaying a list of logs from IIS, Splunk, and other tools.
In previous version of SquaredUp, users have occasionally had difficulties with getting the display right and navigating through the data in the grid. SquaredUp 5.4 has fixed that.
Here are a few of the enhancements we’ve made:
Whether you need to find the needles in a haystack of logs, do some troubleshooting to narrow down to a specific event that's causing you trouble, or maybe display a grid on wall screen for anyone to be able to read, the 5.4 enhancements should have you covered.
Most importantly, all the improvements are available for any grid tiles, including the SCOM and Azure alerts tile.
With the Surface tile, you can build stunning looking dashboards by overlaying your most important SCOM or Azure metrics over any image background.
Using the new display components, you can overlay data on a world map, an architecture diagram, a topology, or any other image to see your most important metrics at a glance.
The Surface tile has a number of configuration options to let you customize the look and feel within a flexible layout.
Download version 5.4 RC here and check out these release notes for more information on what's new: