Bruce Cullen
Director of Products, SquaredUp
We recently released the new Dashboard Server 6.0 with some brilliant new features. If you missed the release announcement, you can catch up by reading the overview blog post which includes the full release webinar.
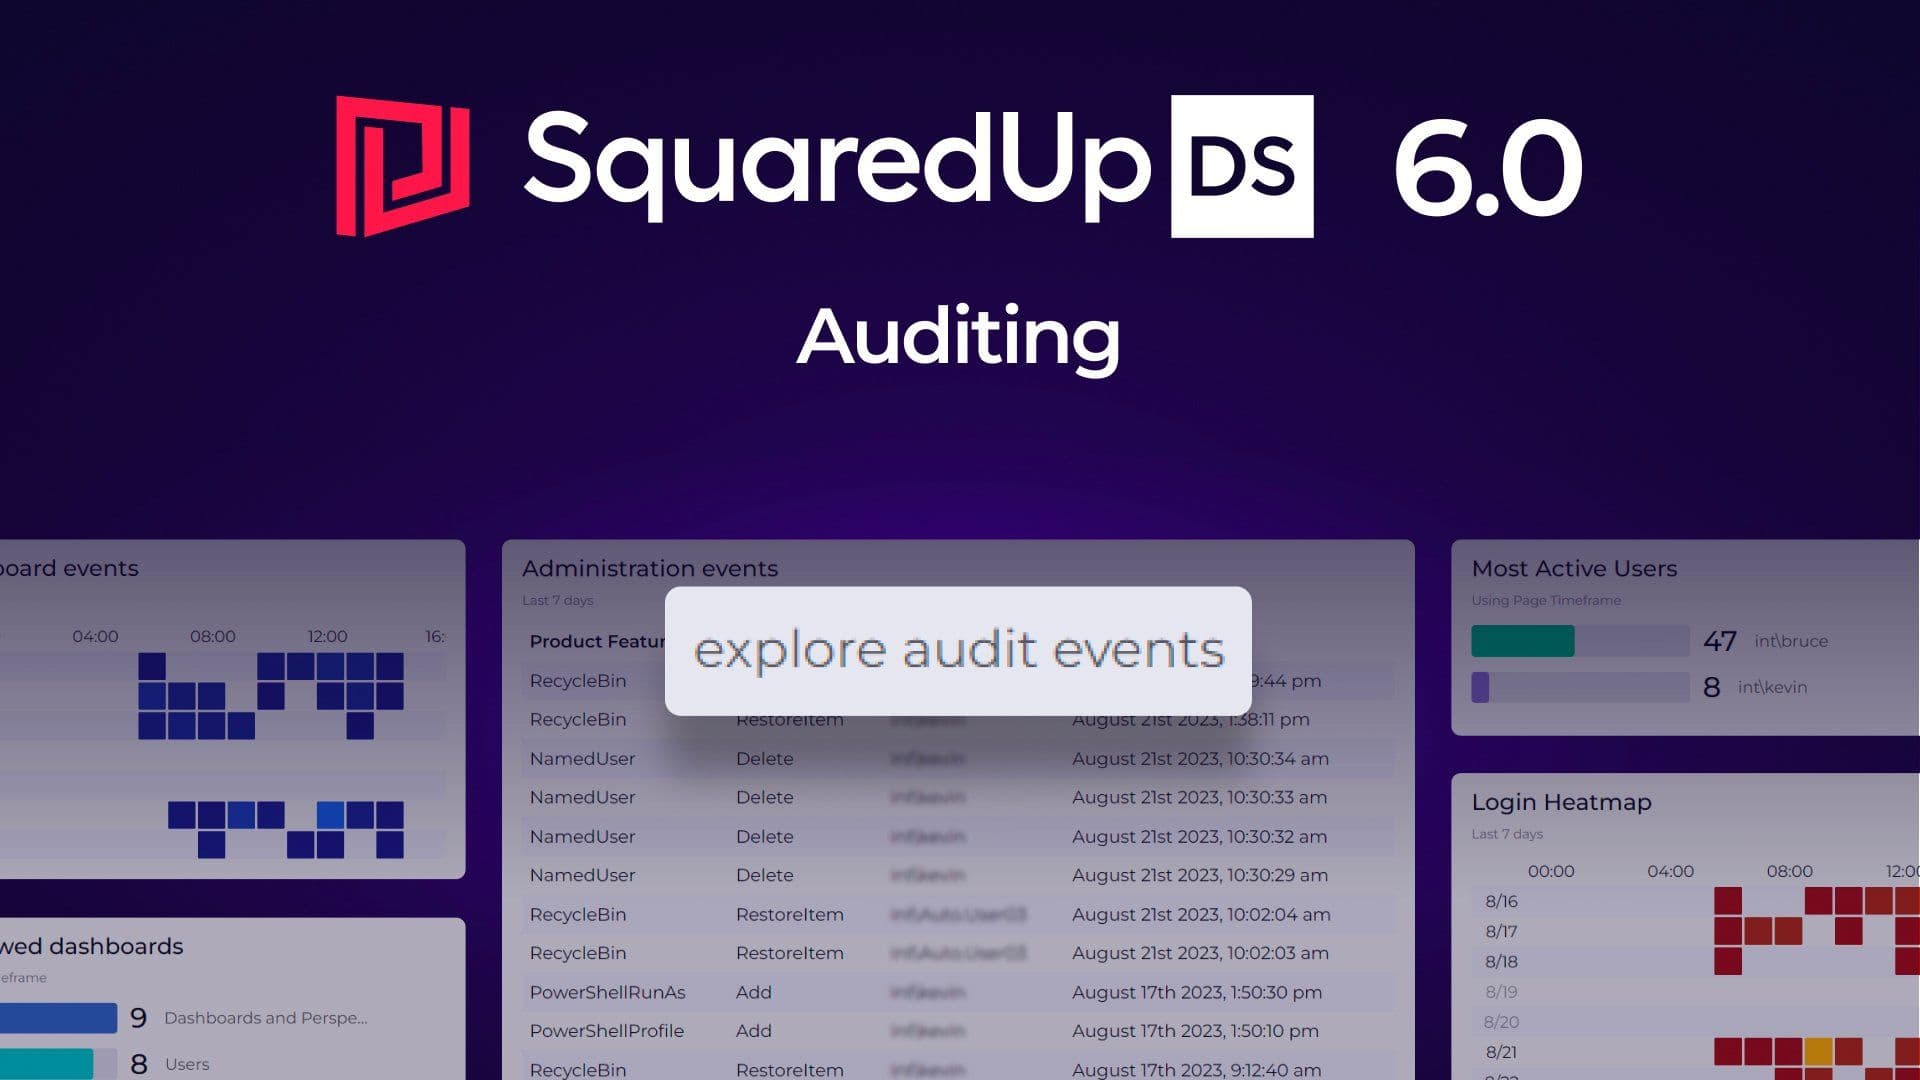
Headlining as one of the biggest updates in 6.0 is the highly requested Auditing feature, which allows you to explore how your users interact with DS for SCOM.
Track logins, dashboard & perspective changes, lifecycle events and more in centralized dashboards for the whole team.
Watch this short video to see it in action, or read on to learn about:
If you’ve ever wondered “what happened to that critical dashboard that disappeared?”, then wonder no more. Auditing seeks to answer this question and more by recording all changes made to DS for SCOM.
Particularly useful for those working in a high-compliance environment, you’ll now have full visibility of:
It allows you to streamline your environment by cleaning up underutilized dashboards, folders, and users, and improve security by tracking all user actions including logins etc.
The Audit explorer is a super easy way to create custom Auditing graphs on the fly by searching, filtering, and visualizing all audit events.
Let's dive into a step-by-step walkthrough of how easy it is to create your own Auditing dashboards and reports.
Start by clicking the ‘explore’ button at the bottom of the ≡ > System > Auditing page or the ‘explore audit events’ button at the top of the auditing dashboards.
You’ll then land on this audit explorer page:
You can filter all audit events by user, content, enterprise application or folder, and search specific keywords i.e a dashboard name. If you have multiple things with the same name, then you’ll see multiple entries.
Because all audit events are stored in a separate SQL database, even if a dashboard or team folder has been deleted, you’ll be able to find it within the Audit explorer!
As an example, let's try and find the SCOM self-maintenance dashboard that seems to have disappeared.
To start, filter by 'content' and search the dashboard name.
Once selected, you’ll see a table on the right that shows all events related to the dashboard, including when it was unpublished, where it is now, and who made the change.
If you want to see what else a specific user has been up to, filter by user, and search the user name to see a full list of audit events:
All of this data can be taken from the SQL database itself, or you can export it to excel by clicking the excel icon in the top right of the Audit explorer view.
For a more appealing view, you can customize the visualization by clicking on the ‘visualize’ drop down. Here’s a summary of Bruce’s activity over the last 24 hours:
You can explore Audit event data even further by filtering by specific event types, i.e., dashboard deletion, and changing the timeframe to show events within set periods.
The Auditing dashboard pack includes five fully customizable out-of-the-box dashboards that allow you to view auditing information for users, dashboards and perspectives, Enterprise Applications and more.
A high-level summary of all audit events made within your environment, shown in a donut and table visualization.
This shows all changes made to dashboards and perspectives including events over time, most viewed dashboards, and event summaries.
Track which users created or modified an Enterprise Application, and when the change was made.
Visualize all team folder events including created, deleted or modified.
Track all user login activity such as most active users, all log in events and log ins over time.
To use the Auditing dashboard pack, you’ll need access to a new, empty SQL Server database (2016 and above). DS for SCOM will then write all audit entries to a table which is automatically created in the database.
<SQLservername>;Database=<AuditingDatabaseName>;Trusted_Connection=True;When Auditing is enabled for the first time, a new SQL provider is added to the ≡ > System > Integrations page named Audit. This allows you to then create SQL tiles targeting the auditing database.
Admins will also find five out-of-the-box dashboards automatically added to the navigation bar. These dashboards can be customized to your liking, or you can easily create your own dashboards from scratch.
For more information on configuring Auditing, check out this knowledge base article.
To get started with 6.0 if you’re new to SquaredUp, see How to install Dashboard Server for SCOM.
You can download the latest version here and read the Release Notes for details on other improvements in this release.
For a step-by-step guide on how to update your Dashboard Server SCOM Edition deployment to the latest version, see How to upgrade Dashboard Server for SCOM.
Happy dashboarding!
Director of Products, SquaredUp