Graham Davies
Technical Product Manager – SCOM products

A dashboard paints a thousand alerts
Technical Product Manager – SCOM products
Series: The State of SCOM in 2026 — Part 7
We've covered why the decision to redeploy on-premises got forced in the first place, why SCOM 2025 is a platform worth trusting, how to migrate onto it cleanly, and what service-level dashboarding gets you once you're there. The last question left is the practical one: which tool do you actually build that dashboard layer on?
Once you've decided your SCOM data deserves a better front end than the console — and most teams eventually do — the next question is which front end. The realistic shortlist usually comes down to three approaches: an open-source visualization tool like Grafana, a general-purpose BI tool like Power BI, or a purpose-built dashboard layer designed specifically for SCOM data. Each is a legitimate choice. They're just not solving the same problem.
Grafana's appeal is obvious: it's free, it's flexible, and it has a large plugin ecosystem and an active community. The honest trade-off is what it costs in effort rather than license fees. Grafana has no native SCOM connector out of the box — getting SCOM data into it typically means going through a third-party plugin or building your own data pipeline against the SCOM SDK or Data Warehouse or patching together SQL queries from Kevin Holman. The limitations are:
It's a build option wearing a low-cost sticker: cheap to license, labor-intensive to run and difficult to scale to enterprise level where service management and service availability are key.
Option 2: Power BI (or another general-purpose BI tool)
Power BI's case is different — it's usually a tool your organization already has, and it's excellent at what it's built for: business analytics, rich formatting, and DAX-based aggregation over structured data. For SCOM specifically, that usually means running SQL queries against the Data Warehouse, or scheduling refreshes through Dataflows or a Power BI Gateway.
The catch is that this is fundamentally a reporting tool, not an operational one. It's a good fit for a monthly service-health report to leadership. It's a poor fit for "something just went red and I need to know what, right now" — the refresh cadence and the query-based model aren't built for that kind of real-time operational use.
Option 3: A purpose-built dashboard layer - SquaredUp Dashboard Server
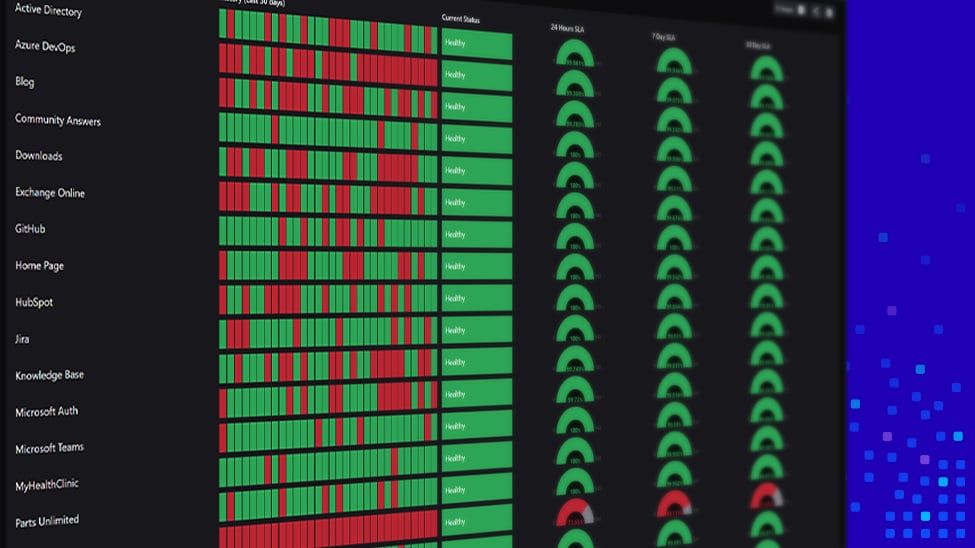
SquaredUp delivers role-based dashboards that work for operations staff, service owners, and management without three separate build efforts.
A tool built specifically around SCOM's data model integrates natively — no separate database, no ETL pipeline to build and maintain, no plugin versions to track. No separate security model.
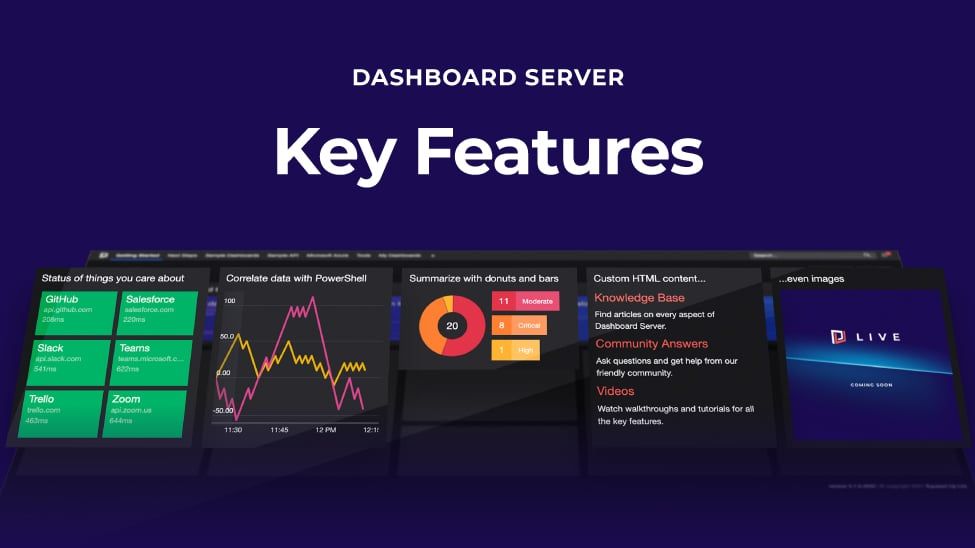
Dashboards are built from tiles that read directly from the SCOM SDK API, optionally blended with other providers (SQL, Web API, PowerShell) if you want to pull in context from outside SCOM, like a CMDB or ServiceNow.
Technical Product Manager – SCOM products