Jason Baudreau
Vice President, Product Management & Marketing, SquaredUp
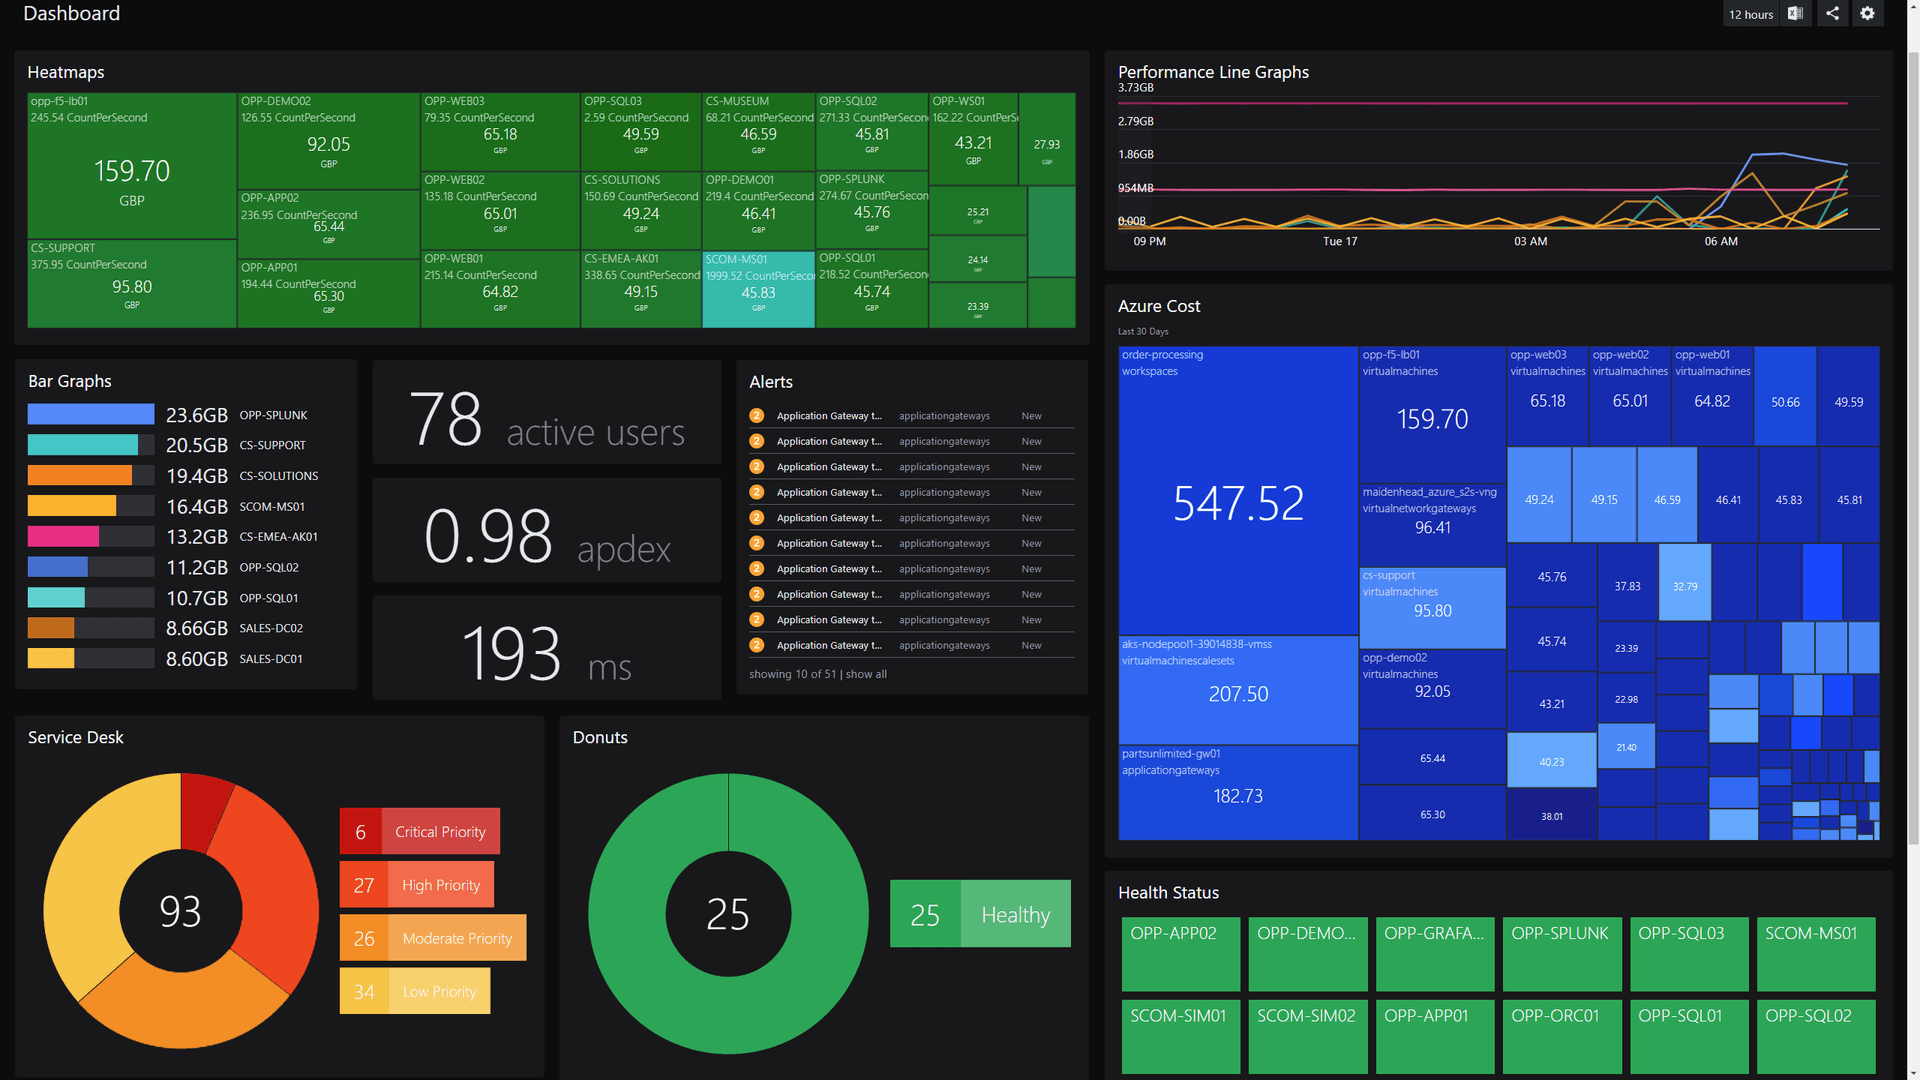
SquaredUp v5.3 continues to help companies reduce tool sprawl and increase observability. With a focus on our most requested features, this release includes impressive improvements to our visualisations.
Our headline improvements include:
Vice President, Product Management & Marketing, SquaredUp

Infrastructure Architect, SIG

Senior Product Manager, SquaredUp