Ashley Thompson
Lead Solutions Engineer, SquaredUp

Application Performance Monitoring (APM) puts applications, more than infrastructure, at the heart of your IT monitoring strategy.
You rely on applications to deliver business services and if these go down or underperform, you lose revenue, customer experience, and productivity fast. That’s why Application Performance Monitoring, or Application Performance Management, is so vital. And it’s also why Cisco were happy to fork out $3.7 billion to buy out AppDynamics back in 2017.
Although, at SquaredUp, we don’t sell APM tools, we do have an Enterprise Application Management (EAM) feature set called VADA that proves we mean what we say about applications being the heart of monitoring. EAM is a little different to APM, but we’ll talk about that later.

Application Performance Monitoring or Application Performance Management (APM) is the active, on-going monitoring and management of the performance, availability, and end user experience of software applications.
APM lies at the heart of modern, multi-cloud observability strategies.
The terms Application Performance Monitoring and Application Performance Management are largely used interchangeably. However, some make a distinction between the terms as “management” suggests a more active approach and “monitoring” suggests a more reactive approach.
Gartner requires that application performance monitoring (APM) suites should meet three main functional dimensions to match their criteria:
APM tools help IT teams with maintaining application availability, optimizing the service, and improving the user experience.
These tools help surface performance issues and monitor the code, requests, answers, error rates, and more of web applications. Put simply, APM tools provide a holistic view of an application’s performance and surface insights that help drive performance improvements that impact the end users.
APM is used on actively developed, “in-house” apps (as opposed to applications that were purchased via a third party) and is typically reserved for applications that are directly revenue-generating or are in some other way central to a business’s core function. In addition, these apps are very often cloud-native.
Some examples of the types of apps that need to be constantly available and without performance issues include app-centric businesses like Netflix, Amazon, and Uber, as well as services like online banking, online government services, and e-commerce stores.
Insights surfaced by APM tools cover both the current delivery of the application and enhancements to the application software itself.
An insight about thedelivery of an application could be, for example, identifying that slow response times for users in Canada are due to issues with a CDN provider.
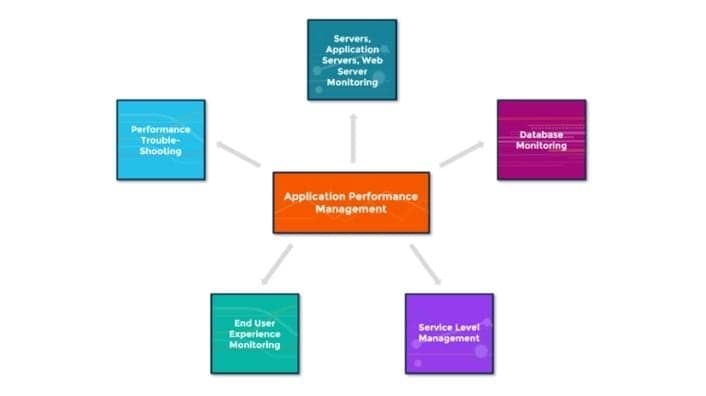
An insight about the enhancement to the application software itself could be, for example, identifying the poor SQL query which is causing slow checkout times for your users. The diagram below displays some of the typical monitoring features that are synonymous with APM:

Teams who choose to invest in APM are putting the end user experience at the heart of application performance management.
Applications exist to serve the business. A failure in the applications to deliver will negatively impact the business and its customers. But it’s easy for IT teams to get wrapped up with the technical side of application monitoring and forget that the end purpose is to serve the business.
Investing in APM puts the focus on your end users.
You shift from a focus on storage, memory, CPU etc. to caring more about business KPIs like:
If you’re adopting a DevOps philosophy and are concentrating your efforts on one or two key applications, then APM is likely to be invaluable. And there’s a rich and competitive vendor landscape at your disposal.
For net new applications, APM represents an opportunity to bake application monitoring, measurement, and improvement right into the core of your application delivery methodology.
For those not given the opportunity to bake APM as part of their application from the start, there’s a very strong use case to retrospectively add this tooling to high profile, revenue generating apps.
Think about it. Downtime for an eCommerce store would be positively catastrophic – and examples aren’t exactly few and far between. Earlier this year, Amazon were estimated to have lost $72 million to $99 million when their customers experienced connectivity issues for just over an hour. Yikes.

Avoiding outages like this is one of the main reasons businesses are turning to APM. Their prescriptive/predictive capabilities will often highlight issues before they impact the end user, and although these types of tools can be pricey, the opportunity cost will almost certainly be greater.
APM and EAM – Enterprise Application Monitoring – aren’t in opposition.
In fact, Enterprise Application Monitoring (EAM) takes the service-centric approach to monitoring first used by APM and applies it to the masses, albeit at a different level of detail.
For that reason, your organization should have both APM and EAM on its radar.
Businesses need IT services that work, and that means applications that that don’t go down or slow down. And whilst you might know the status of your infrastructure, do you really know where to look when things go wrong?

Sure, Application Performance Management (APM) tools offer a lot of promise, but the nature of its evolution means APM is far better suited for monitoring web apps than any other. And with enterprise IT typically responsible for hundreds, if not thousands of applications – across Windows and Linux, SQL and Oracle, on-prem and the cloud – APM isn’t necessarily the answer for the majority of your enterprise applications.
This is where Enterprise Application Monitoring (EAM) comes in.
EAM scales application-focused monitoring to the masses, whilst APM tools deliver richer, code-level insights for a select few. The best bit? EAM utilizes your existing monitoring stack so there’s no need for any news agents, databases, or infrastructure.
Discover SquaredUp’s EAM capabilities in the Visual Application Discovery Analysis (VADA) feature.