How to add Solarwind nodes to your Enterprise Applications
Today we welcome David Morris, a System Centre Engineer for one of the world's largest law firms, who has written a special guest blog about the Solarwinds community MP. A must read for anyone who has Solarwinds and Microsoft System Center Operations Manager (SCOM).
We'd like to thank David for taking the time to write up this fantastic piece of content - it's another great example of the SCOM community hard at work.
Using the Solarwinds community MP with SquaredUp
David Morris, System Center Engineer
For those of you that use Solarwinds for network monitoring, the Solarwinds community MP created by Ruben Zimmermann is a must have.
This MP is available via the SquaredUp community MP, with instructions from Ruben, here.
Once you have this in place, your network devices should be available within SCOM with health states linked directly to Solarwinds - but for me, this is just the start...
First let’s take a look at how these Solarwinds Nodes appear in SquaredUp. This is one of my Citrix NetScalers.

Linking SquaredUp to Solarwinds
From this point, the first thing we need to do is find out what’s wrong if there's an error. As this isn’t brought in directly via the MP, the first thing I set up was the Solarwinds link

to jump directly to my node in Solarwinds itself.
To do this go to the settings cog

and add a new perspective action.

From here, you can use the nodeID property from the object to build a dynamic link to the node in Solarwinds.

Viewing Solarwinds node alerts on the SquaredUp perspective
Next, we can move onto enhancing the node view using the SquaredUp SQL grid tile.
First connect the grid tile to your Solarwinds SQL.

Once that's done you can add a script, like below, to bring in all open alerts from this Node into the perspective.
<span style="background-color:rgba(0, 0, 0, 0);color:#FC5751" class="has-inline-color">SELECT</span> [AlertObjectID]
		,[AlertMessage]
		,[TriggerTimeStamp]
		,[LastUpdate]
		,[Notes]

  <span style="background-color:rgba(0, 0, 0, 0);color:#FC5751" class="has-inline-color">FROM</span> [SolarWindsOrion].[dbo].[AlertStatusView]

<span style="background-color:rgba(0, 0, 0, 0);color:#FC5751" class="has-inline-color">Where</span> ActiveObject = {{properties.nodeID}}
Finally, you can then use the grid options to add a dynamic link back to the alert using the alertobjectID from the query.

Adding Solarwinds nodes to Enterprise Applications and Visio Dashboards
The final step is to visualize the health state of these network devices as part of your application dashboards.
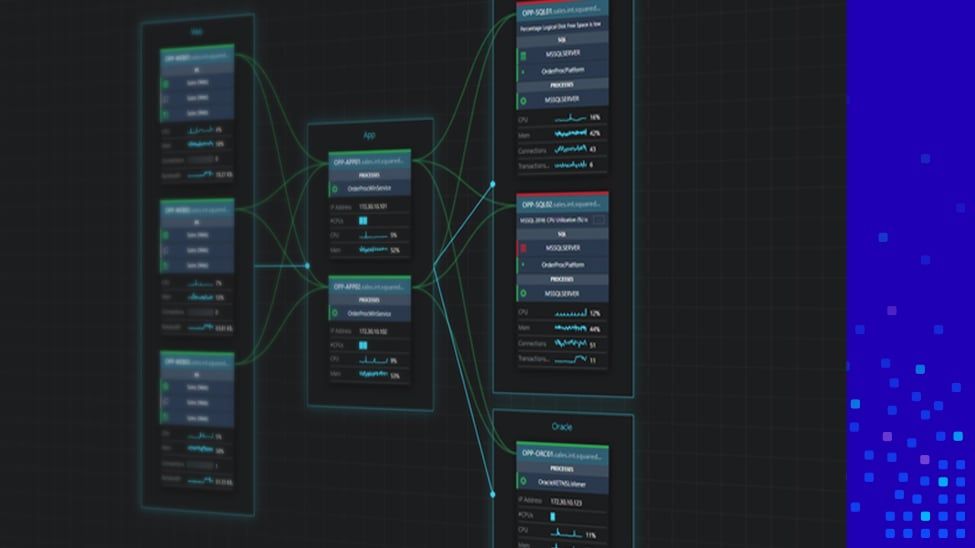
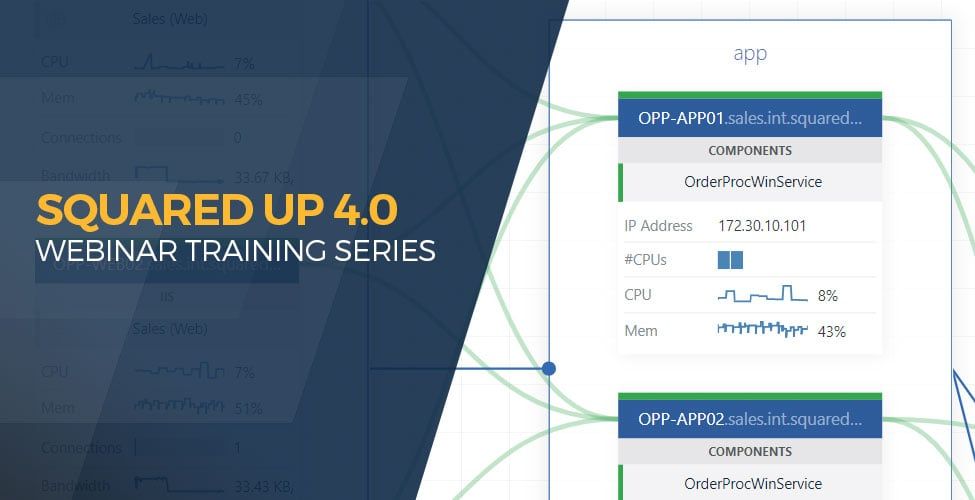
With the release of SquaredUp 4.0 you will now be able to add these nodes directly to your application maps when building enterprise applications. And even though you won’t be able to discover them directly, adding the health states into your application maps will help identify where potential issues may lie.
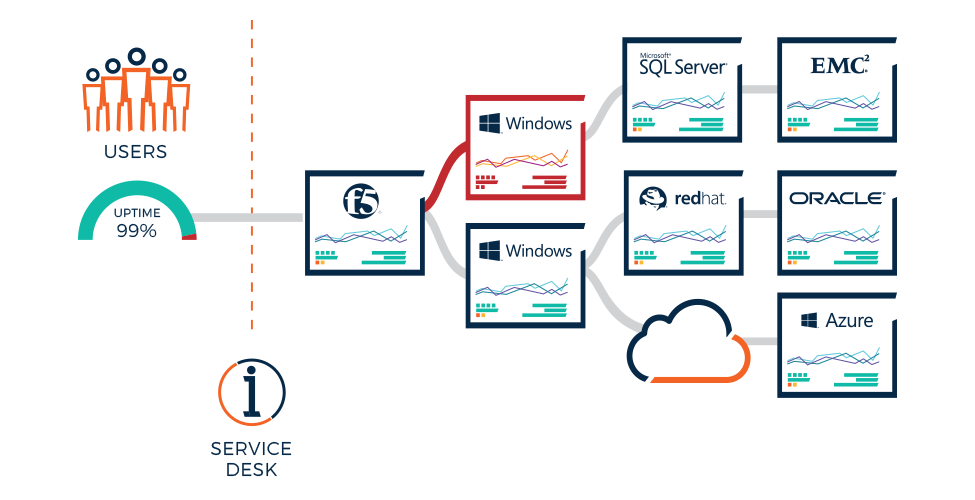
You can also build extremely powerful dashboards by using Visio to visualise the health state information from server infrastructure, server components, and network devices to give high impact wall displays using open access.

As above you can see how you can use Visio to visualize an entire application. This diagram includes monitoring for Windows Servers, SQL instances, Network Nodes and URL endpoints. From one look you can instantly see where any issues are occurring.

