
Veeam availability console API and SquaredUp
This week we're delighted to bring you a special guest blog from Craig Dalrymple, aka. @cragdoo.
Craig's a long-term blogger and engineer at Brightsolid, a leading Scottish data centre and cloud solutions provider. He's also a Veeam Vanguard which, for those of you not familiar with the term, is essentially the same as Microsoft's MVP program. That means he really knows his stuff when it comes to all things Veeam.
Luckily for us, Craig's also a dab hand in SCOM and SquaredUp and lately he's been combining his powers to show how you can use SquaredUp's WebAPI Tile to pull data from the Veeam Availability Console and put it onto your dashboards, allowing you to easily keep an eye on things like the status of your backup jobs and your remaining capacity.
Craig's put together a detailed walk-through of his latest adventures in WebAPI world and has been kind enough to guest blog them below.
We highly recommend staying up to date with all the latest from Craig directly via his blog and Twitter but, for now, over to you Craig...
Veeam Availability Console API and SquaredUp – API Dashboard
By Craig Dalrymple
In my 2 previous posts (Post 1, Post 2) I went through the process of using Postman and Swagger for running RESTful API queries against 2 Veeam Products (Veeem Enterprise Manager and Veeam Availability console). In this post I’m going to go through a practical application of API query results to list Veeam Backup and Replication job results and repository sizes, in both tabular form and scalar form.
Now gathering API metrics is relatively straight forward, using your API client of choice, as I demonstrated in my aforementioned blog posts. However displaying the results in a useful and easy to understand format is another problem altogether. I’m no developer, so I could spend a considerable amount of time learning something like Angular or ReactJs to achieve this, but as a total newbie to this area I went in search of a simpler tool. My search did not take me too long, as we already used SquaredUp in house.
SquaredUp
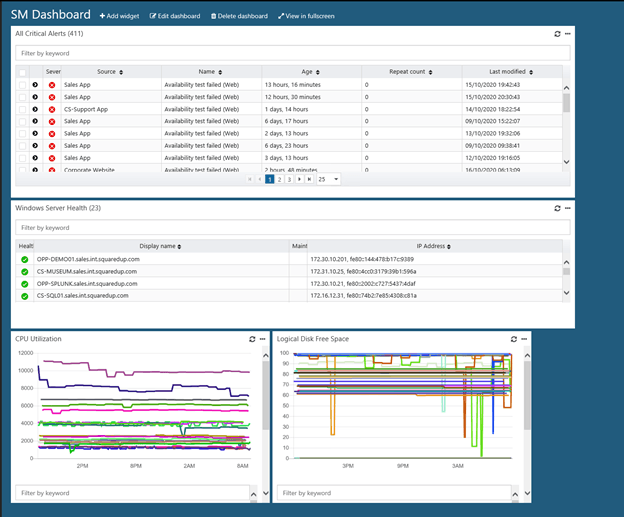
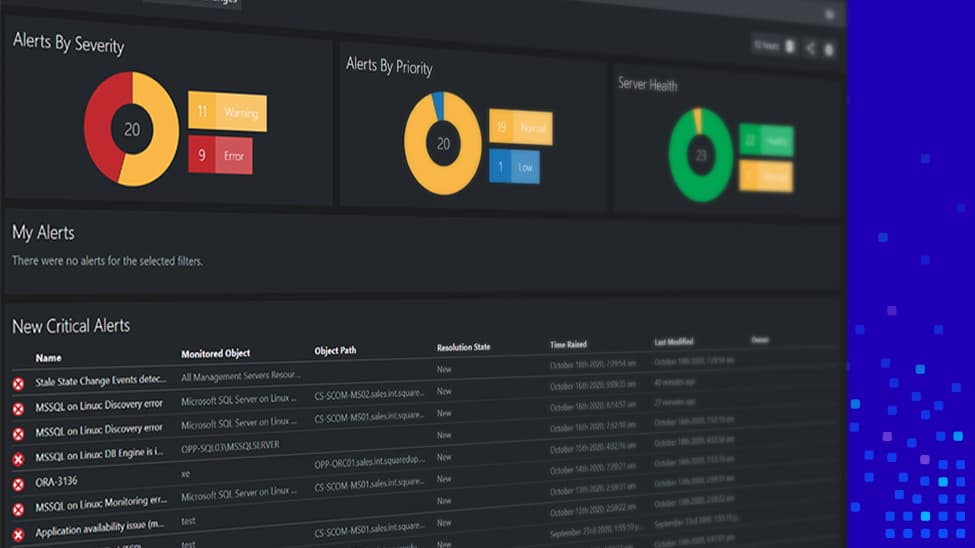
For those of you not in the know SquaredUp is an HTML dashboard application that sits on top of Systems Center Operation Manager (SCOM). Now if any of you have SCOM in house I’m sure you will agree that SCOM does a fantastic job of collecting metrics from all sorts of sources. On the other hand displaying those metrics is unfortunately where SCOM certainly has room for (significant) improvement. This is where SquaredUp really excels, by utilising the same SCOM data but being able to display that same data in fast and responsive HTML dashboards. If you are running SCOM in your environment do yourself and your SCOM admins a favour…install it!

I won’t cover the installation nor configuration of SquaredUp in this post. I will point you in the direction of SquaredUp’s very own beginners guide, Getting Started with SquaredUp.
NB: You will need to have a SCOM environment to connect to, even if you’re only interested in the Web API Tile.
Back in June 2017 the cool kids at SquaredUp released v3.1 and along with a new WebAPI Tile and while learning the basics about APIs I had a slight “Eureka!” moment. Could I connect to and display queries from my Veeam Availability Console test environment?
SquaredUp API Setup
To connect to you API source of choice you will need to add a ‘Web API Provider‘ in SquaredUp.
1. Login to your SquaredUp instance via http://<squaredup-IP-or-FQDN>/SquaredUpv3/logon and enter your credentials:
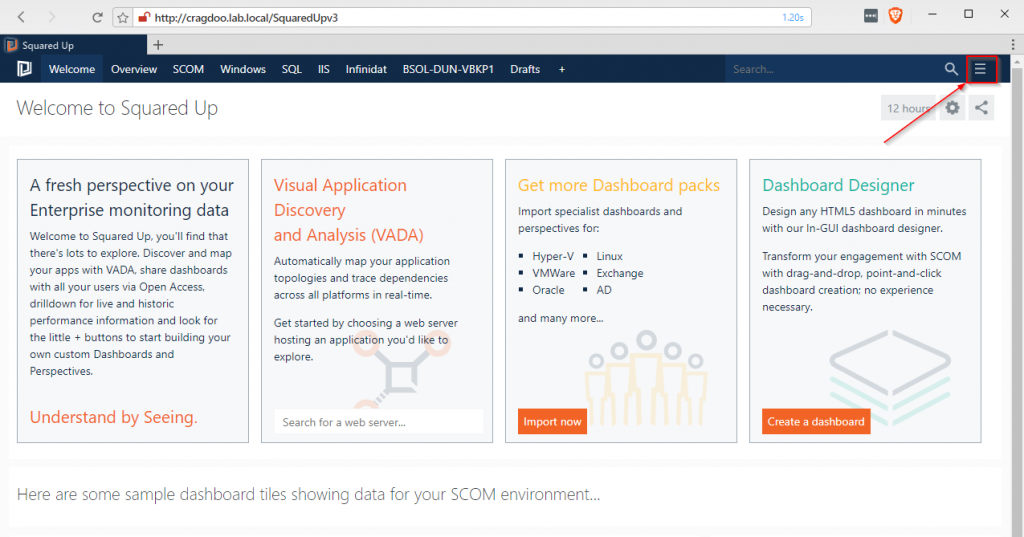
2. On the main screen click on the 3 parallel bars in the top right-hand corner:

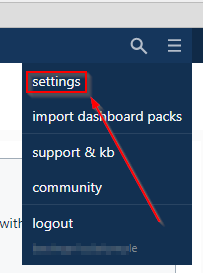
3. Now select settings from the drop down menu:
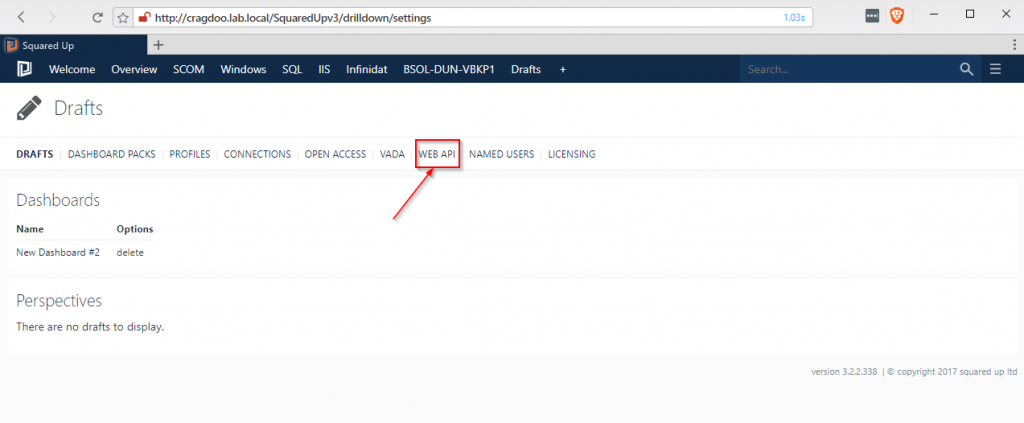
4. On the Settings screen click on WEB API:
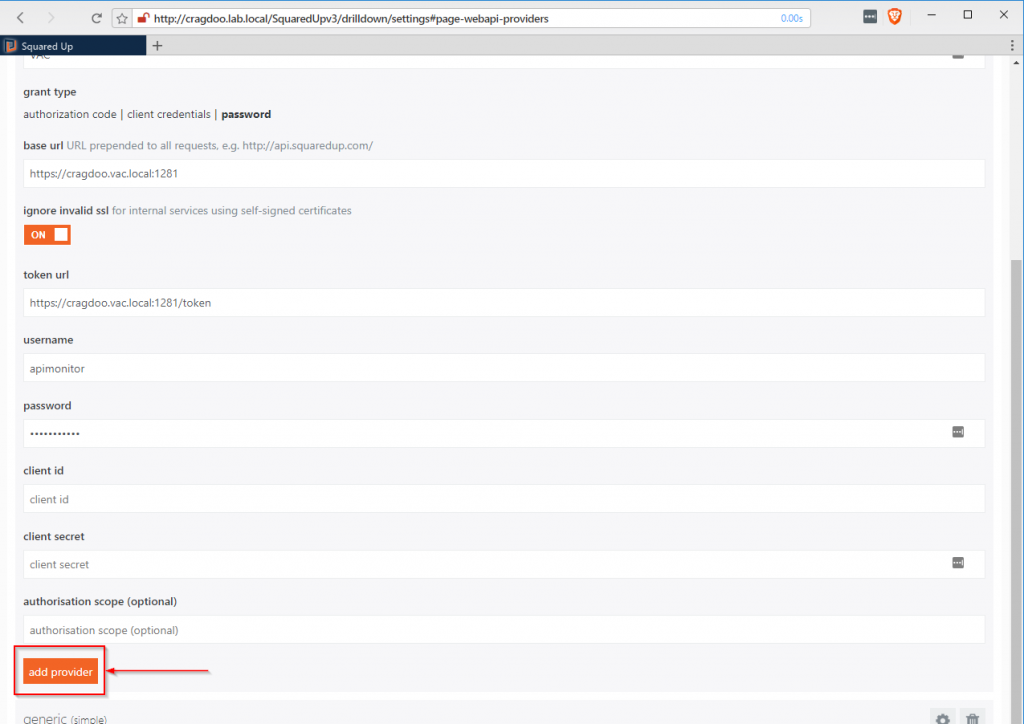
5. On the WEB API section, click on the add new provider button:

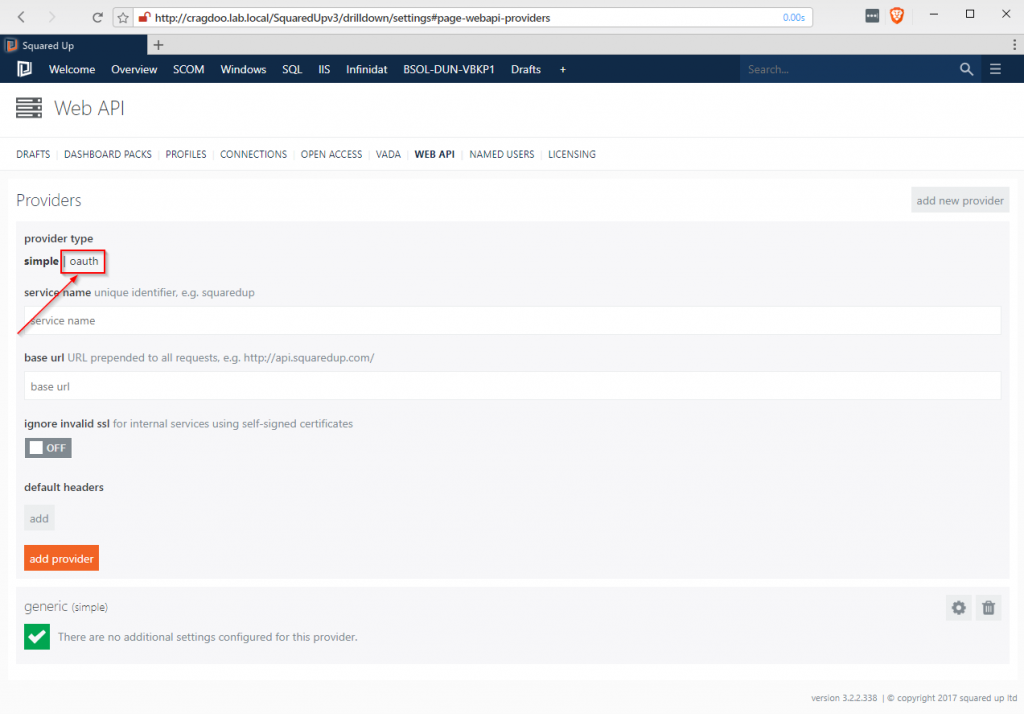
6. Depending on the authorisation type of your provider API you may need to, as in my case, switch from a simple provider type to an oauth provider type. Click onto switch:
7. Give your provider a service name, in my example ‘VAC‘:
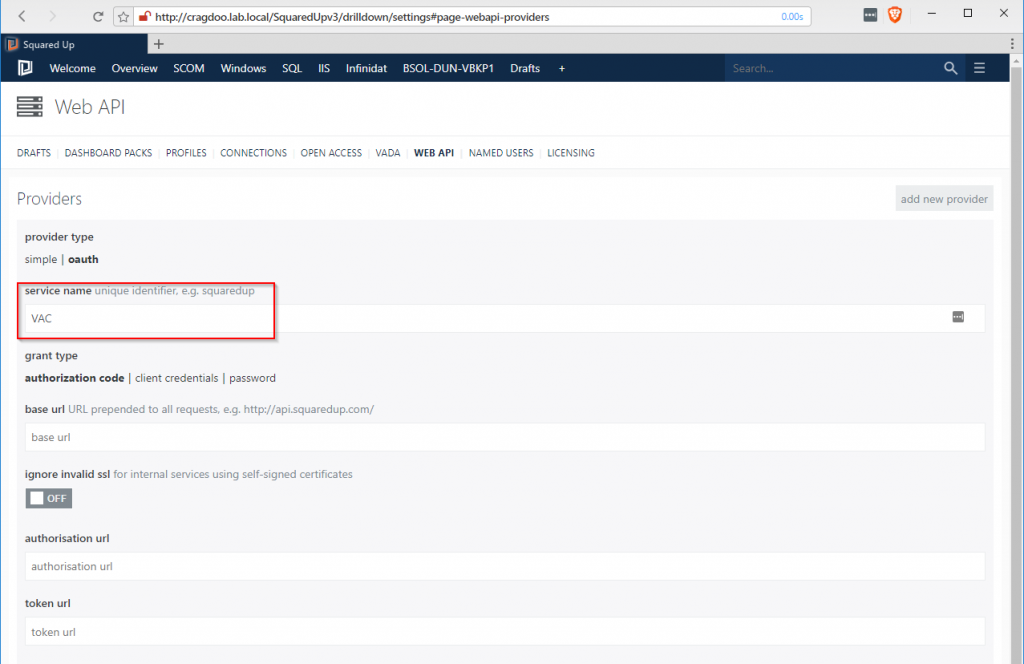
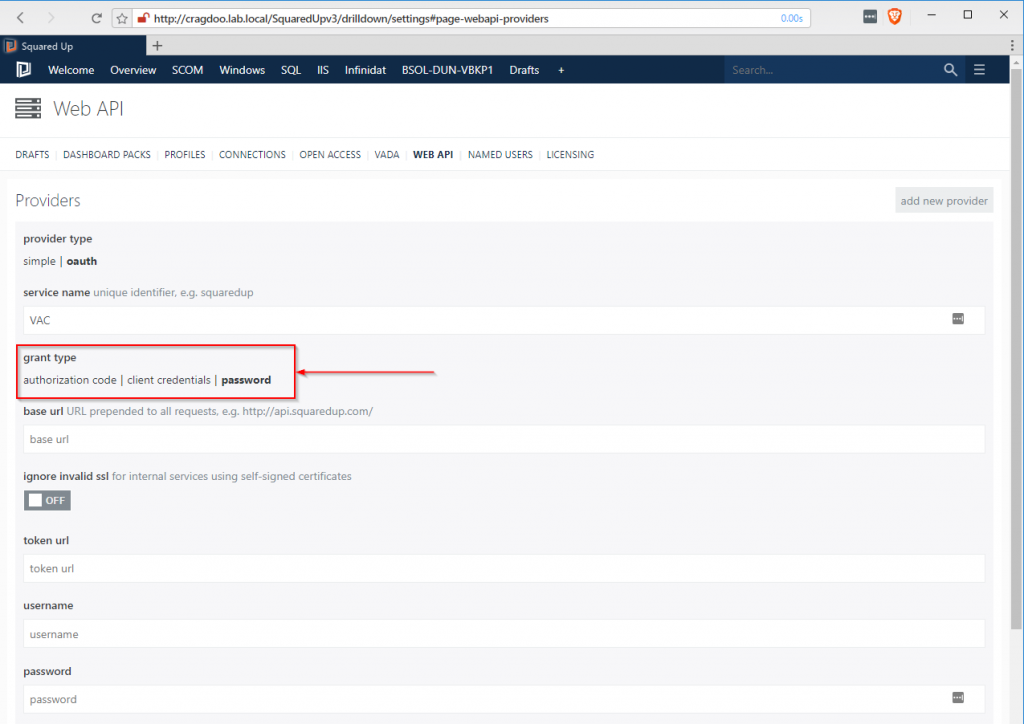
8. Again depending on your API provider’s authorisation method you will need to choose the relevant grant type. With VAC I need to use password:
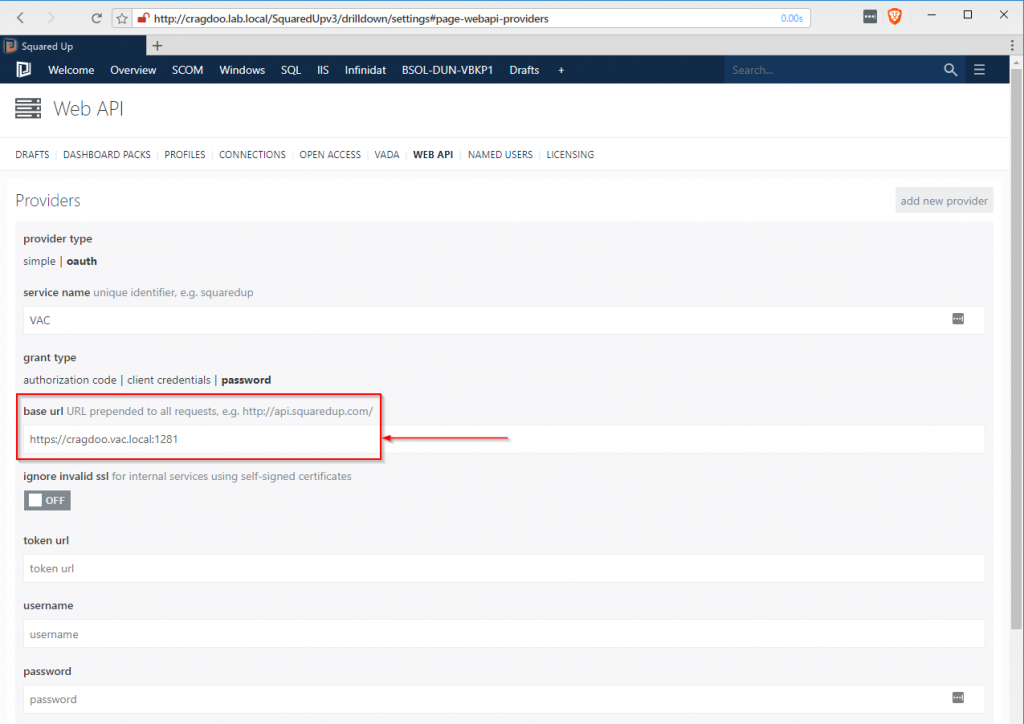
9. Now enter the base url , for my VAC it is https://cragdoo.vac.local:1281:
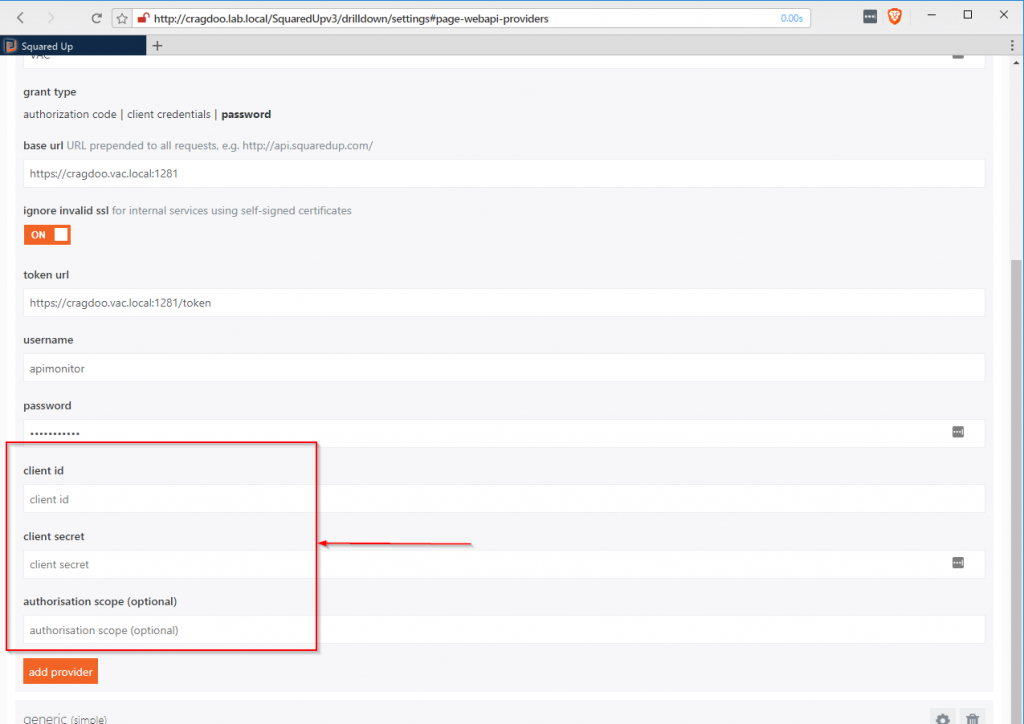
10. As this is a lab and I am using self-signed certificates I enable the ignore invalid ssl:
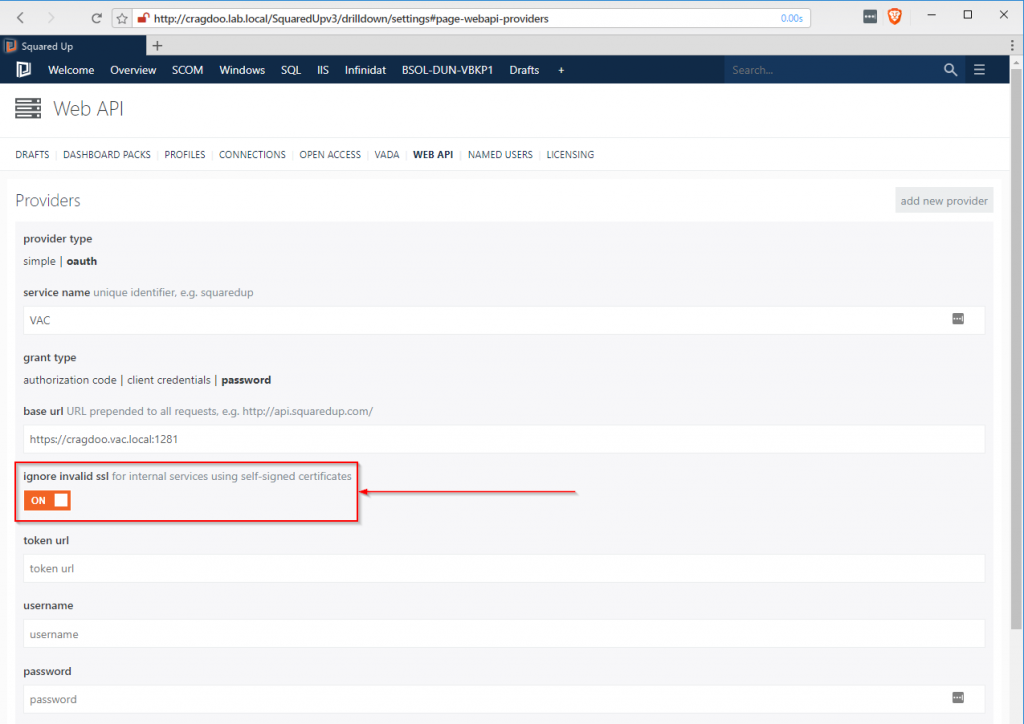
11. As VAC uses a refresh token system for API authorisation so I need to specify the token url:
12. Now enter the username and password for the VAC site. Tip create a local account on your API system just for the API access:
13. Client id, client secret and authorisation scope can all be left blank:
14. Now click on add provider:
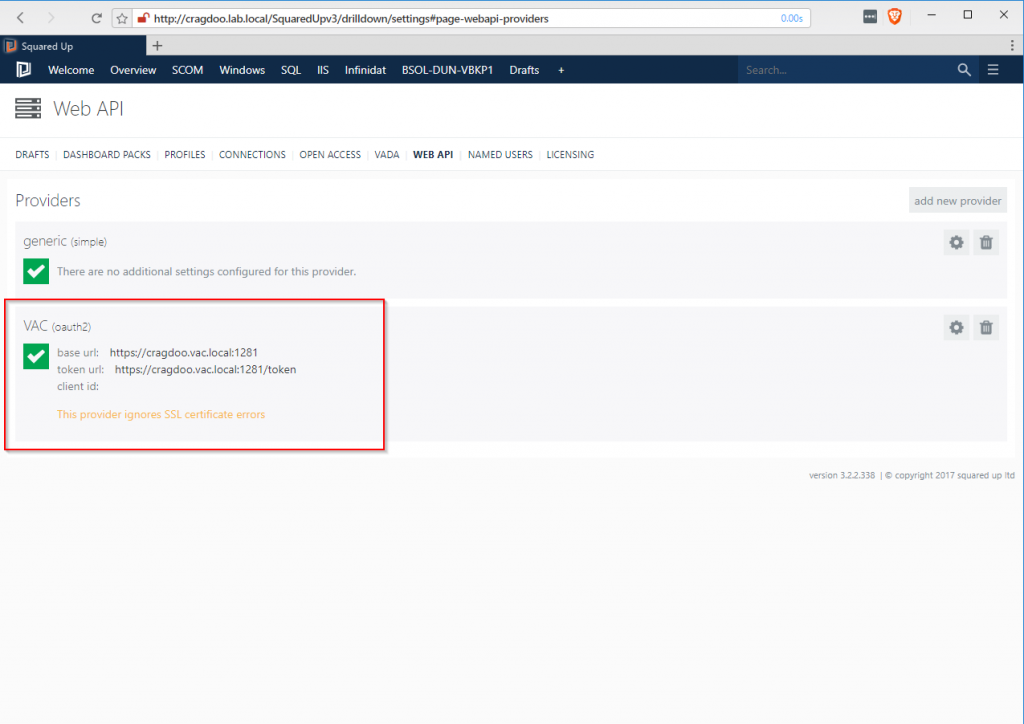
15. If the session is successful in authenticating the Provider will be listed with a green tick:
Dashboard creation
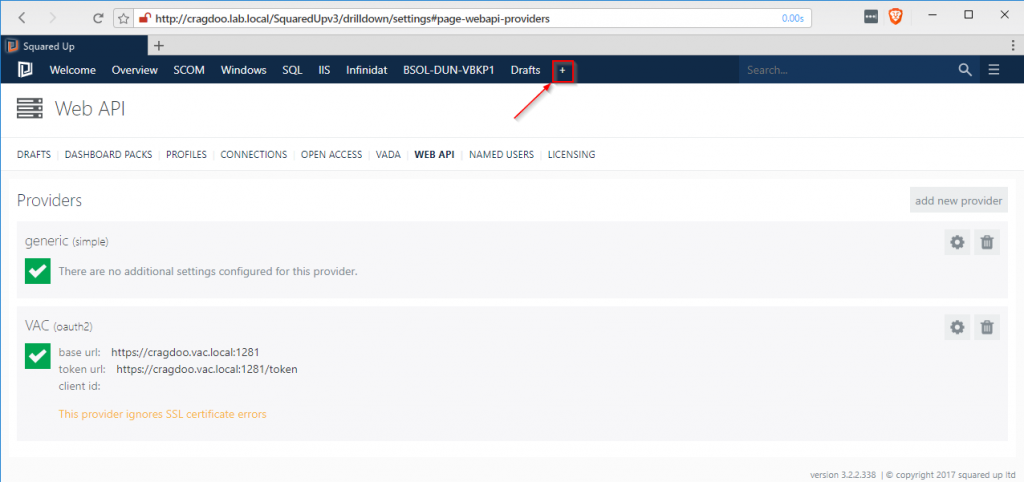
Now we have the VAC provider define we can now start to build out some dashboards. Let’s start with a list of backup jobs.
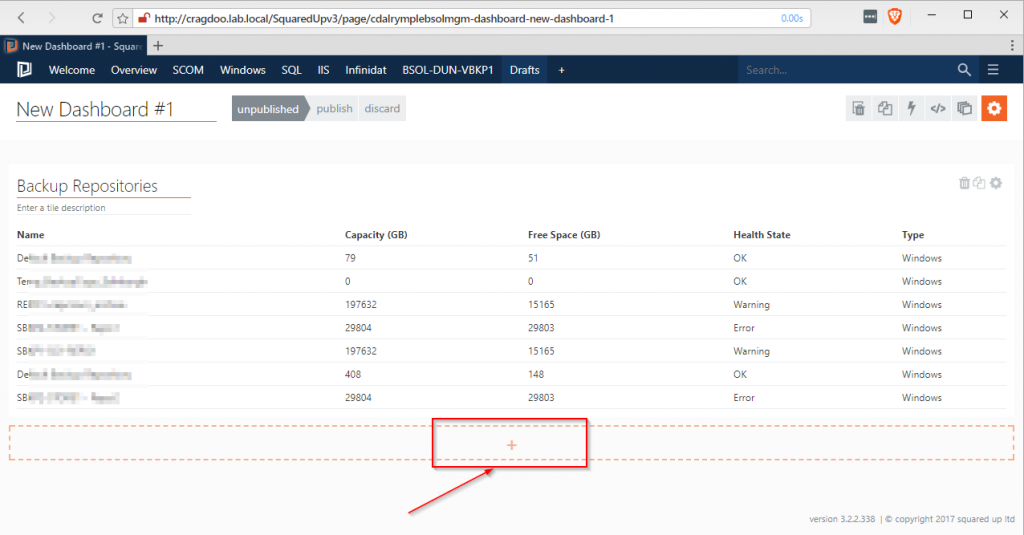
1. From the top bar click on the + to create a new draft dashboard:
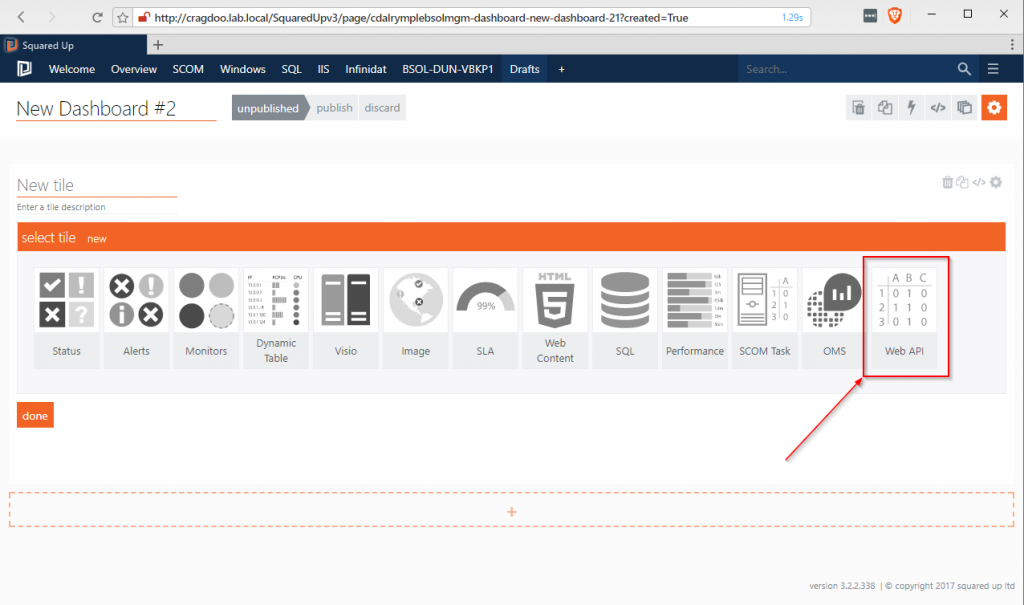
2. On the new dashboard select the Web API tile:
3. Now pick Web API (Grid):
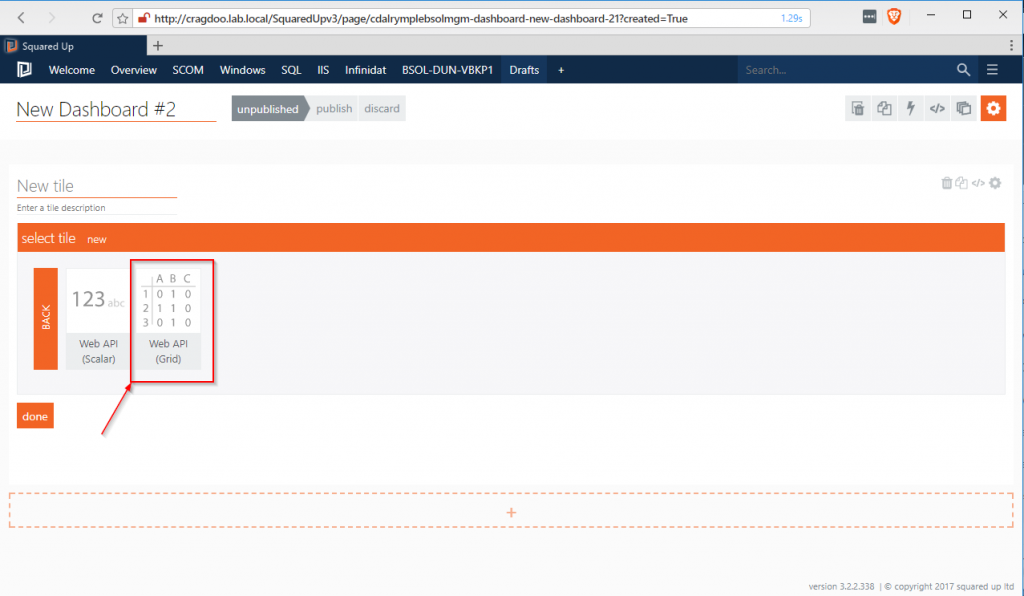
4. From the Provider drop down list select the relevant provider, in this case VAC, and click next:

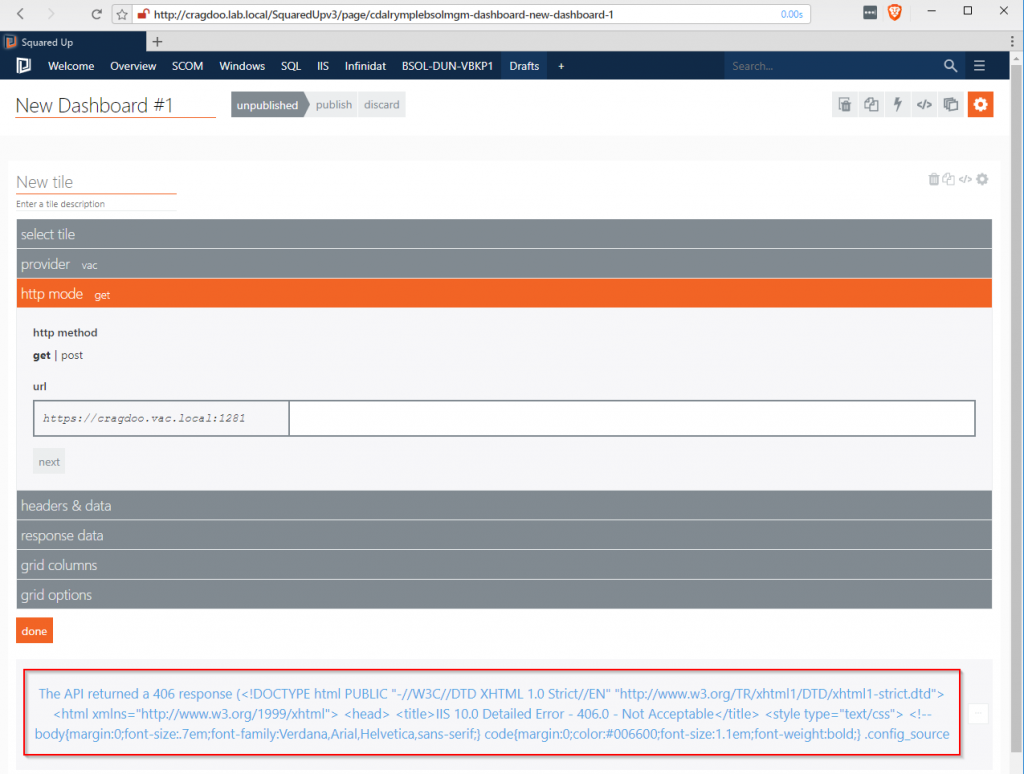
5. Don’t worry if you see error messages in the lower half of the scree, this is due to no API resources being specified just yet:
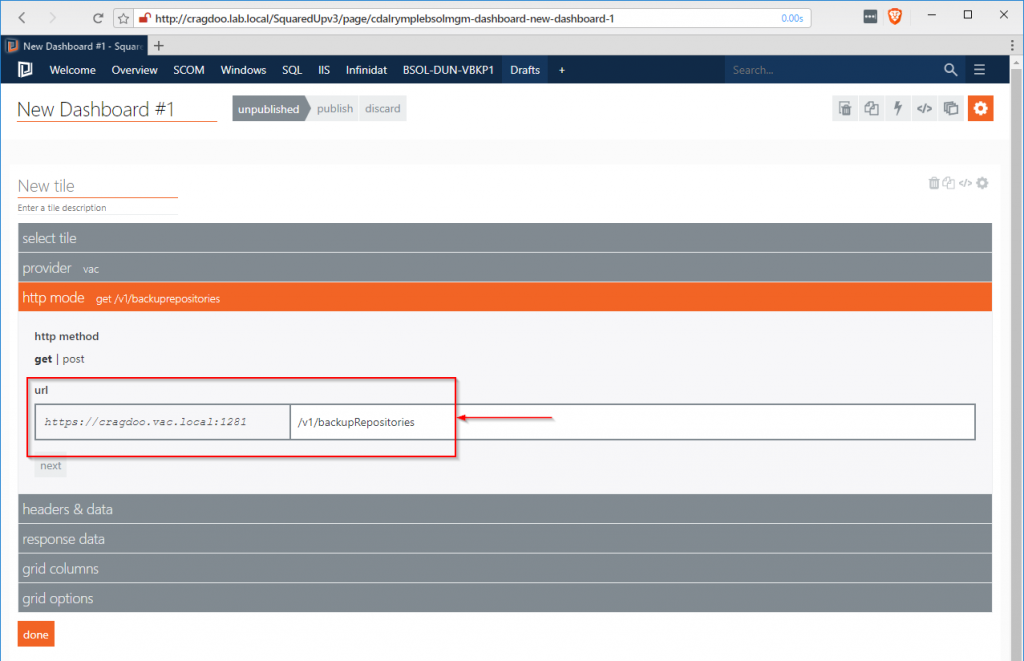
6. In the http mode section ensure the mode is set to get and enter /v1/backupRepositories as an addition to the url string and click next:
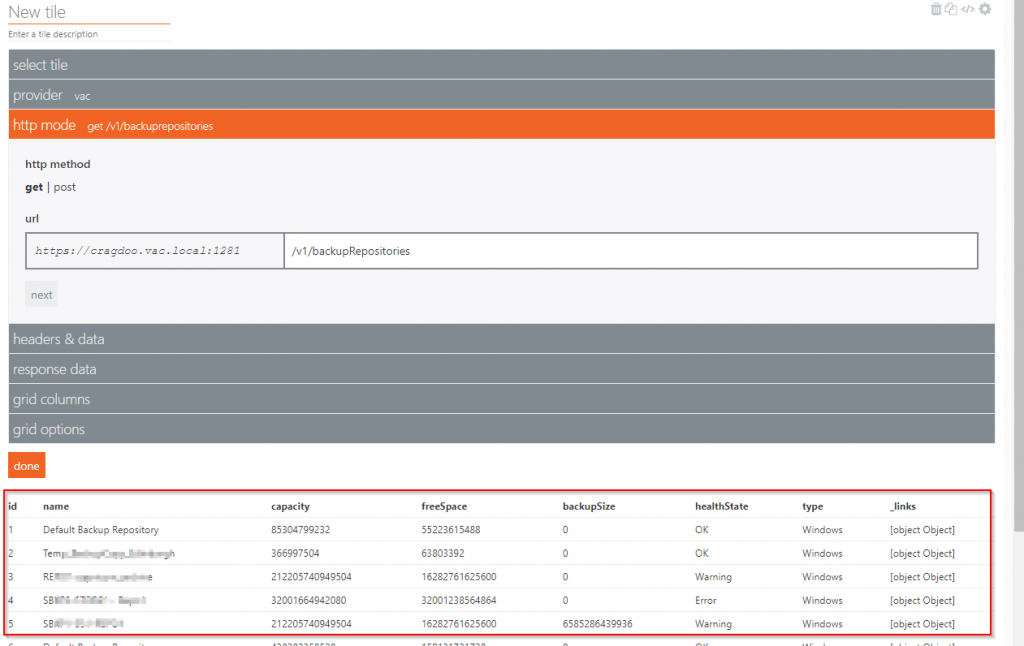
7. If the url is a valid resource then you will see data populated:
8. The headers & data section can be used to pass extra headers/values into the API query. In this case it is left blank. Click next:
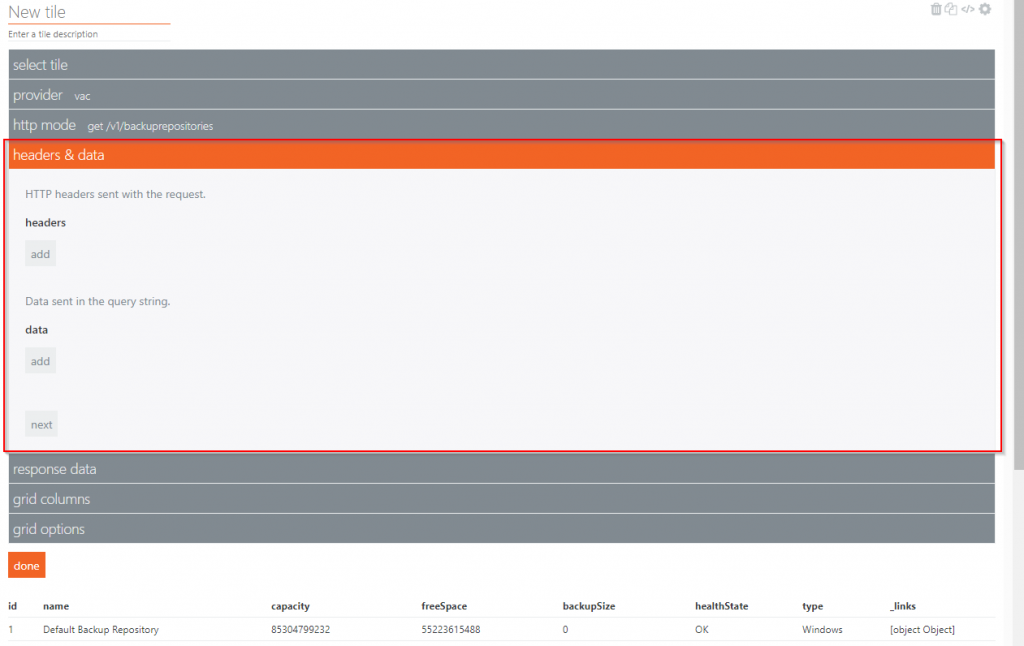
9. Repsonse data can be used to filter down the query results further. Again in this example it is left blank. Click next:
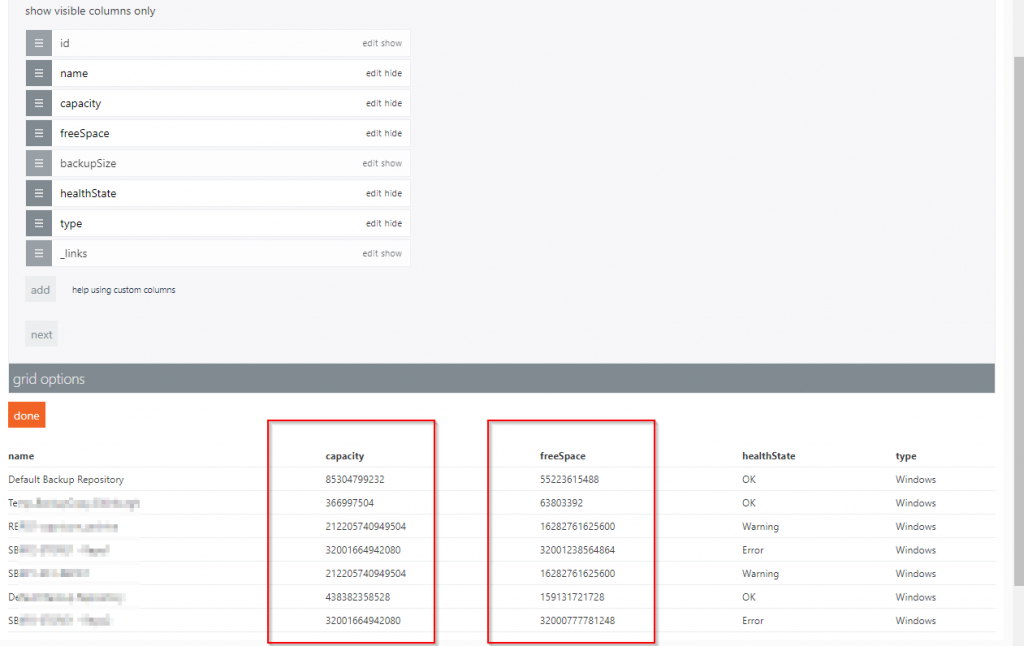
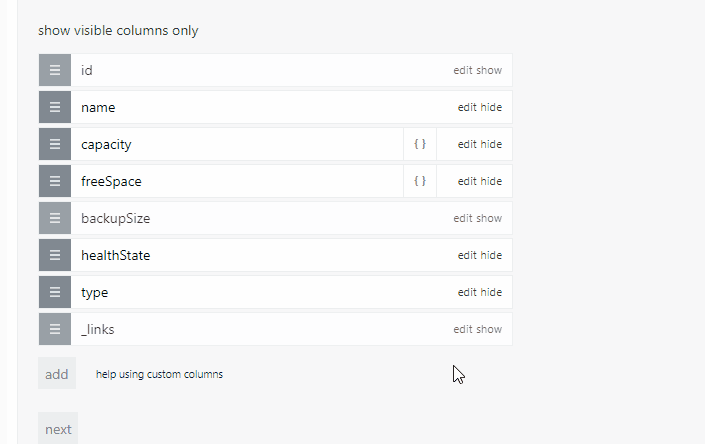
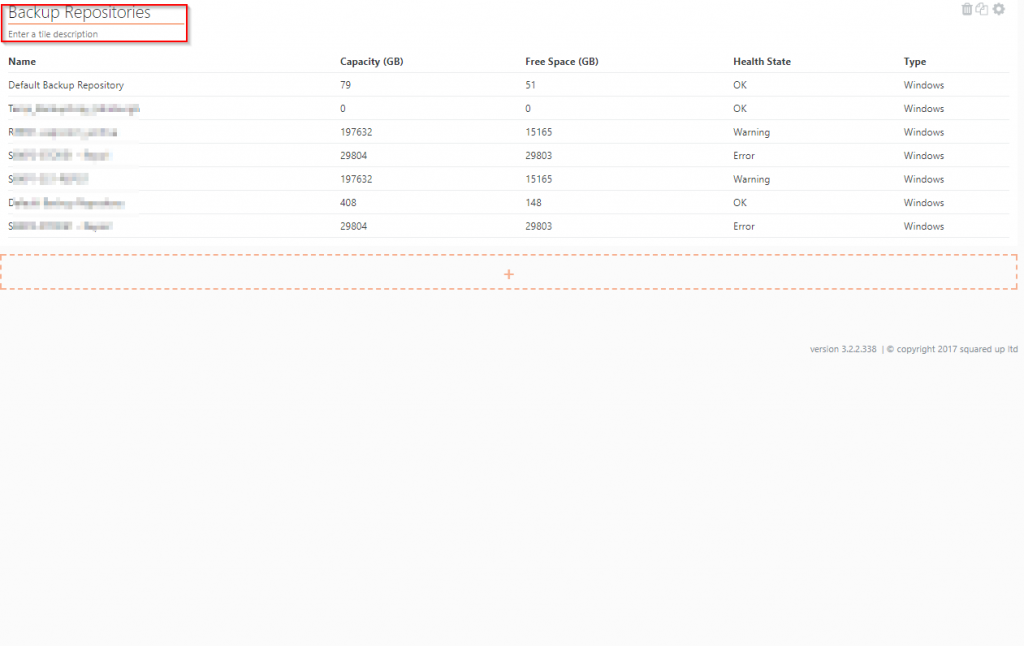
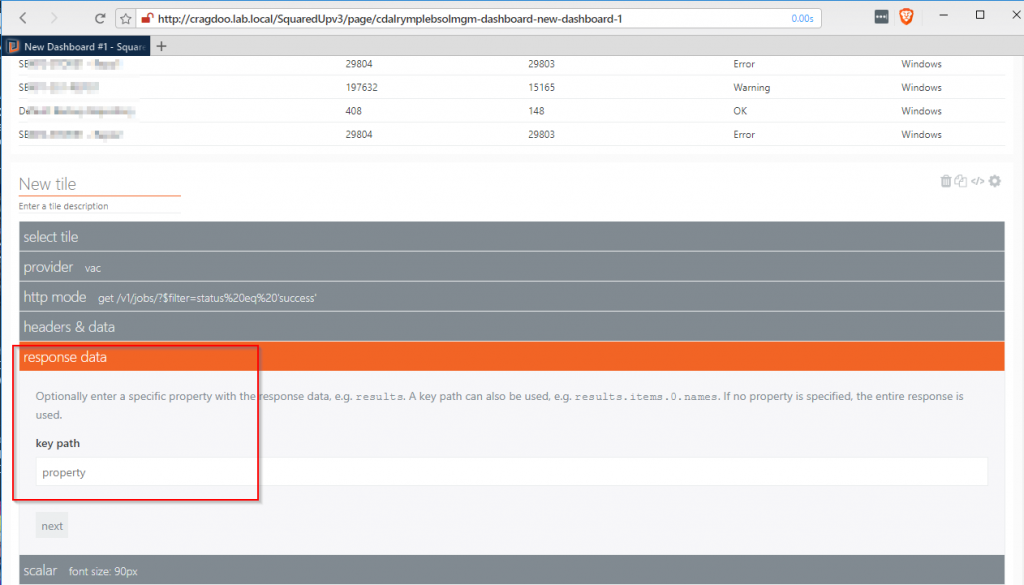
10. With grid columns we can be selective about which columns to view, as well as editing the column values. To hide a column click on hide. In this example I will hide id, backupSize and _links:
11. Once hide button has been pressed the column will be hidden from view. To show all the columns, including those you’ve hidden, click on show all columns. Those columns that were previously hidden will be shown in light grey:
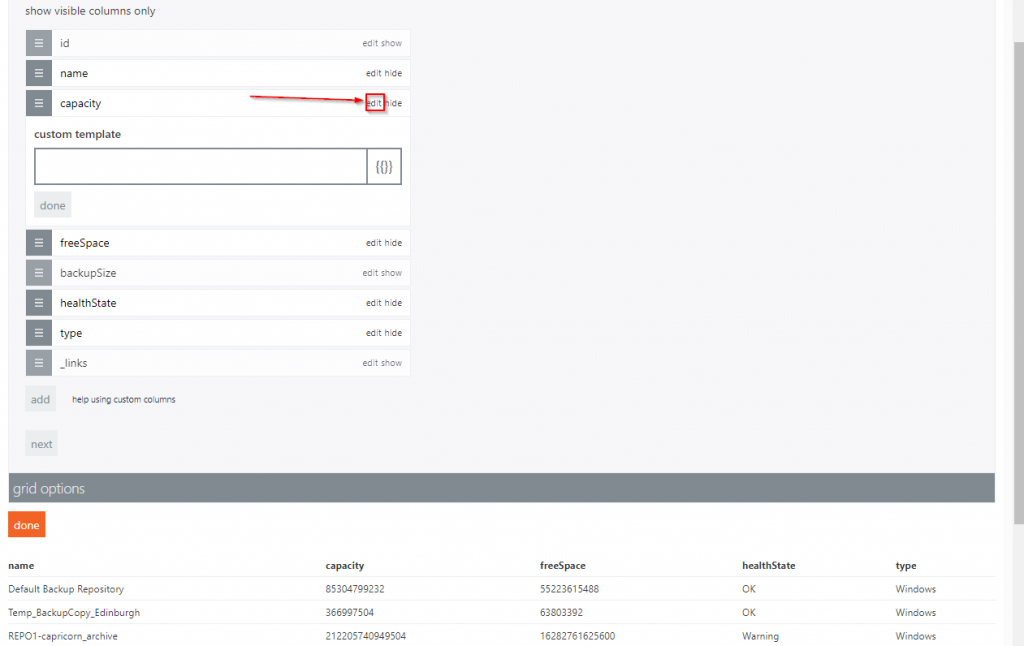
12. We can also manipulate the column data by clicking on edit. For example, the capacity and freeSpacecolumn value is shown in bytes:
13. Now this not ‘human friendly’ , so we can apply some maths these values. To convert the value of bytes into Gigabytes we need to divide the value by 1073741824:
1GB = 1073741824 B
14. Click on edit for the capacity column and you’ll be dropped into the custom template section:
15. The values can be manipulated using ‘Mustache’ syntax so to divide the value of the column by 1073741824 we use the syntax:
{{Math.round(value/1073741824)}}
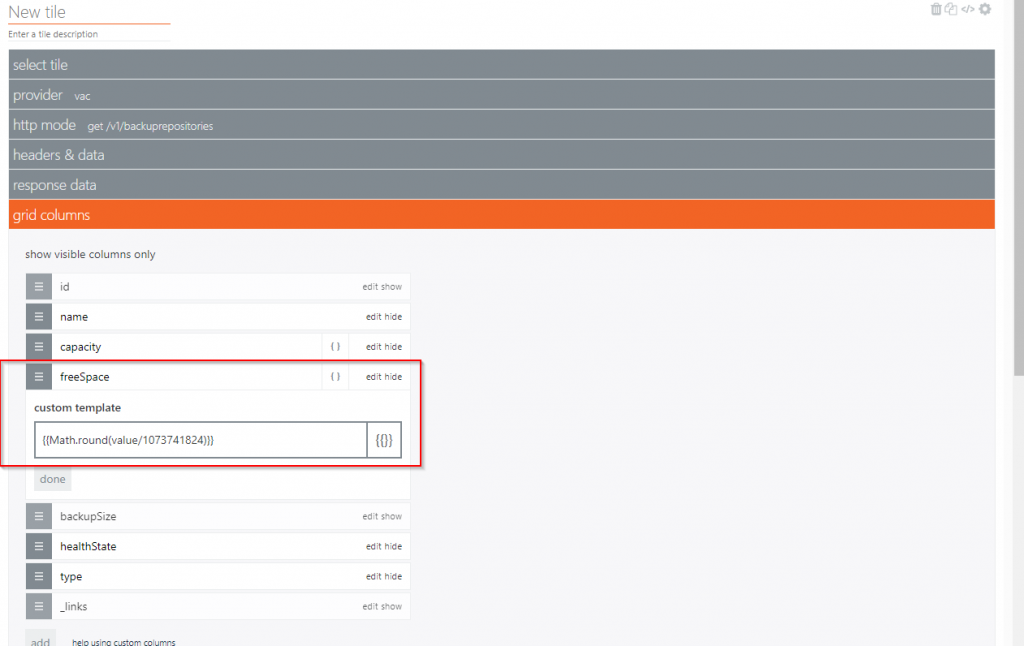
16. Click on the freeSpace edit and apply the same formula:
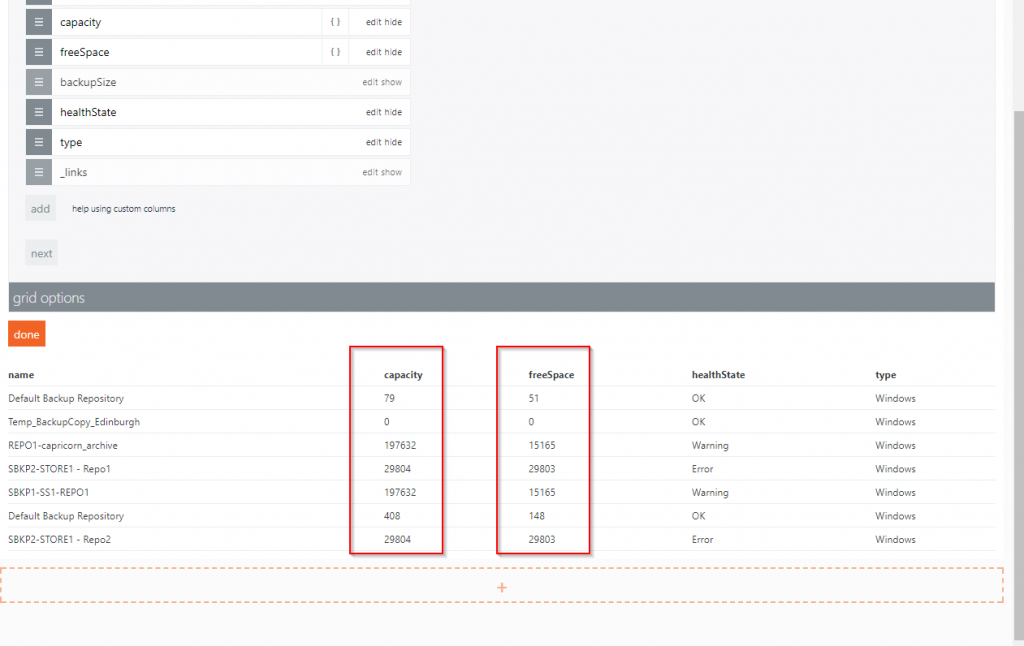
17. If you scroll down, you will see that the formula has been applied and the column values have changed:
18. We can also update the column titles to something more suitable by clicking the column name and typing in relevant text. For example freeSpace to Free Space (GB):
19. We can also rename the other column names:
20. Click on Done and our grid is complete. Give it a title by clicking on New Tile and entering an appropriate name:
21. Now let’s add some scalar Web API tiles. Click on the orange + to add a new tile:
22. Again click on the Web API tile:
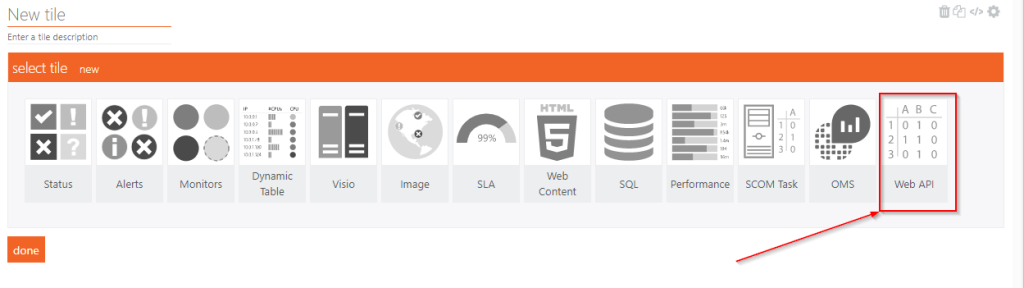
23. This time select the Web API (Scalar) tile:
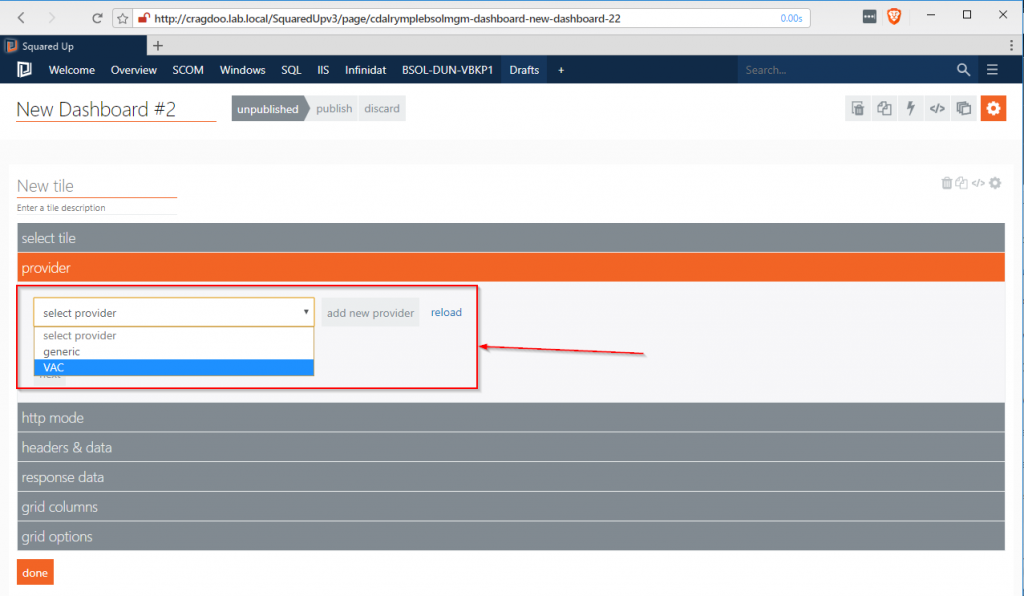
24. Select your provider (VAC in this example):
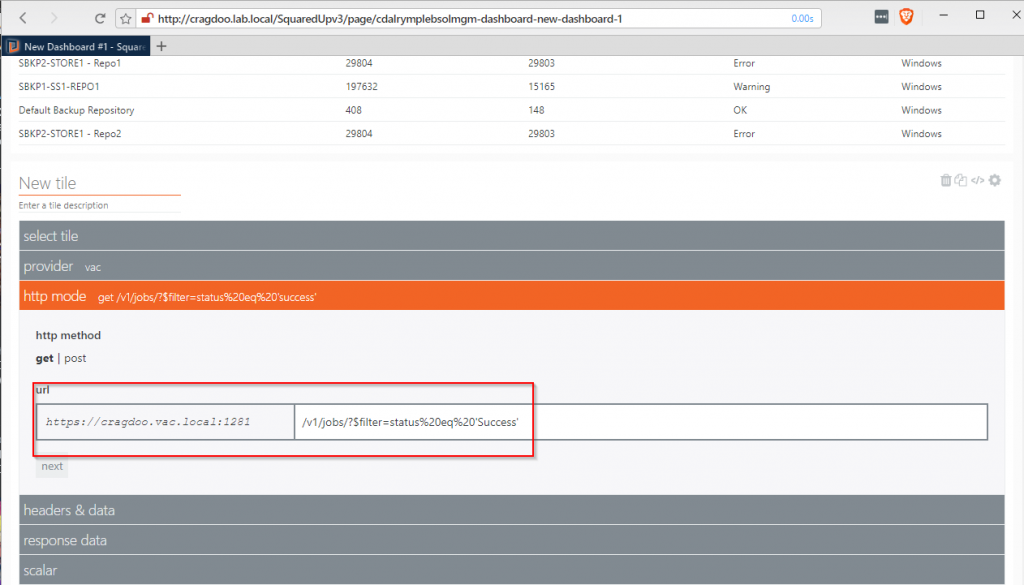
25. This time I’m going to apply some formatting to my API query. This query will be looking for successful backup jobs only, so the url will be /v1/jobs/?$filter=status%20eq%20’Success’:
26. Again headers & data are left blank:
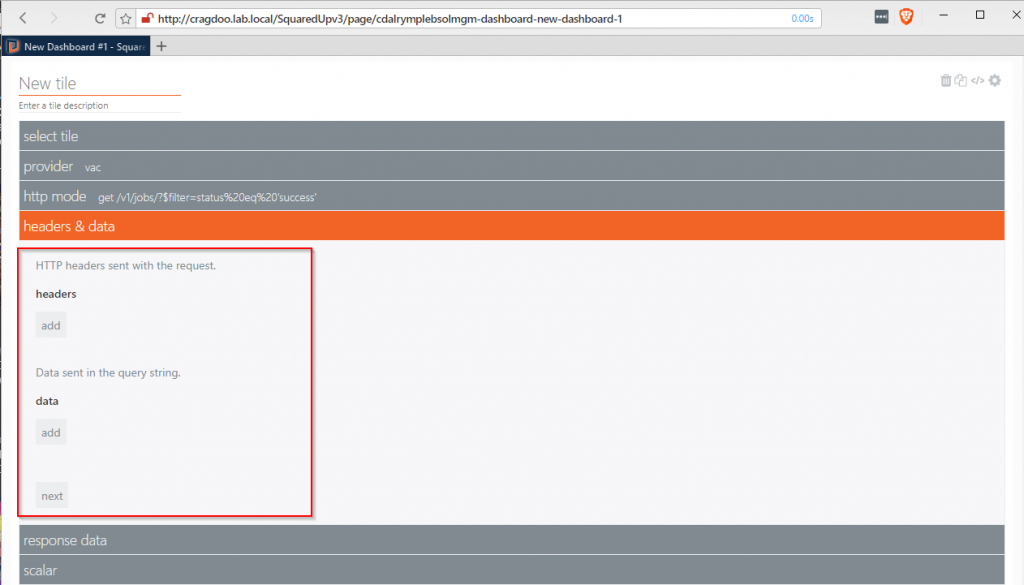
27. No response data specified:
28. In the last section of scalar we can change the font size as well as define a unit:

29. The resultant tile:
30. Rename the tile to Successful:

Now we have the basics in place we can create some additional tiles, with relevant queries and change the layout to our needs:
Additional Tiles
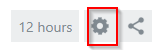
1. Click on the cog icon , top right hand, to enter the dashboard editor:
2. And then click on the tile clone button:
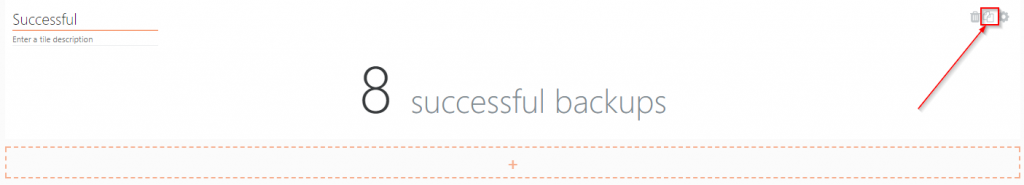
3. This will create a duplicate tile, which we can then edit to show Warnings:
a. Rename the tile to Warnings
b. Click on the edit tile button:

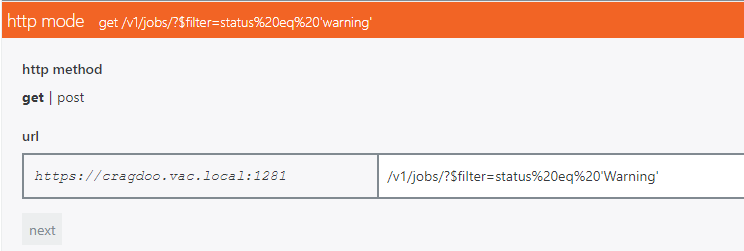
c. Change the http mode query to /v1/jobs/?$filter=status%20eq%20’Warning’:
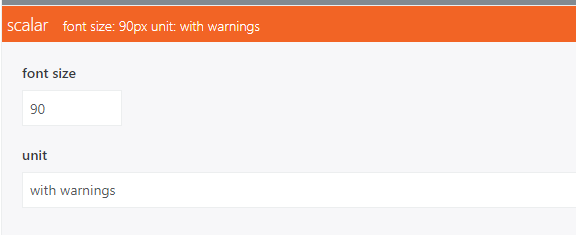
d. Change the Scalar unit to ‘with warnings‘:
e. Click done
4. Again clone the tile, and rename as Failed
a. Change the http mode query to /v1/jobs/?$filter=status%20eq%20’Failed’:
b. Update Scalar unit to ‘Failed Backups‘:
c. Click done
5. Finally, click on the cog symbol to exit the dashboard editing mode:
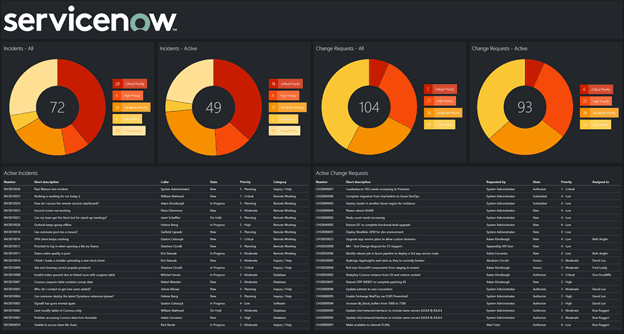
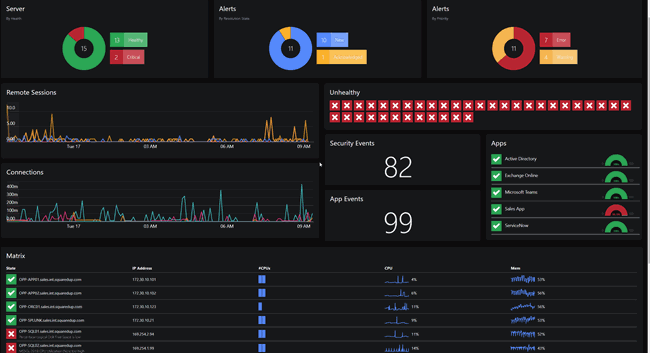
Our dashboard now looks like:
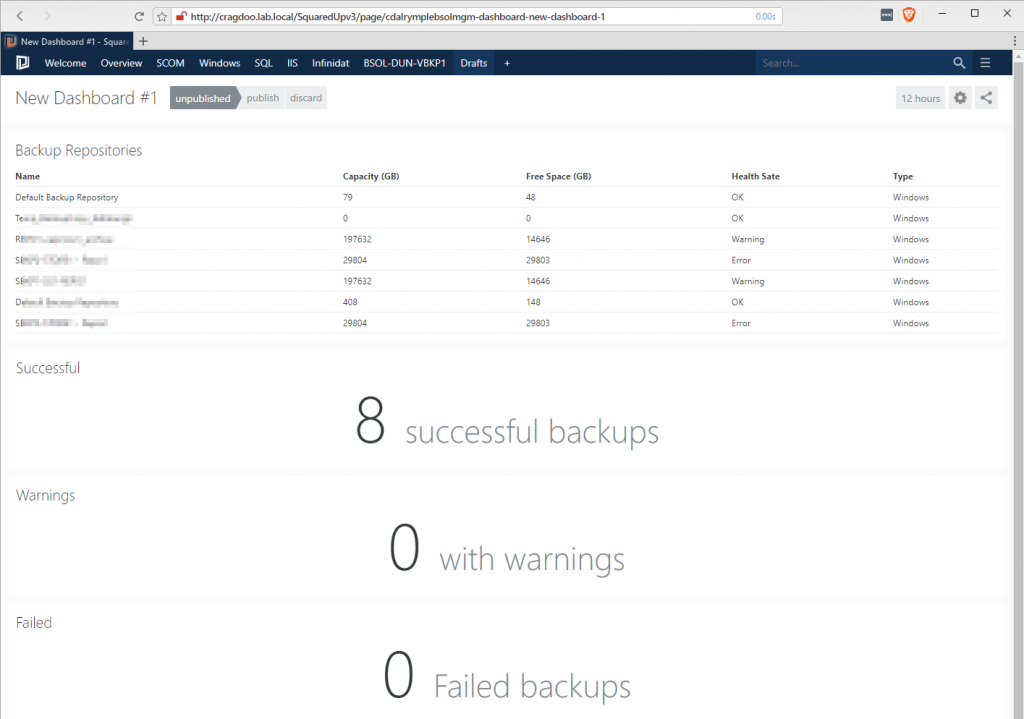
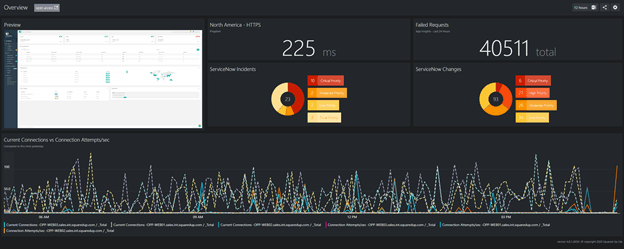
In my final dashboard, I’ve added a tile to query and list all the Backup Jobs and re-arranged the layout to fit my purposes:
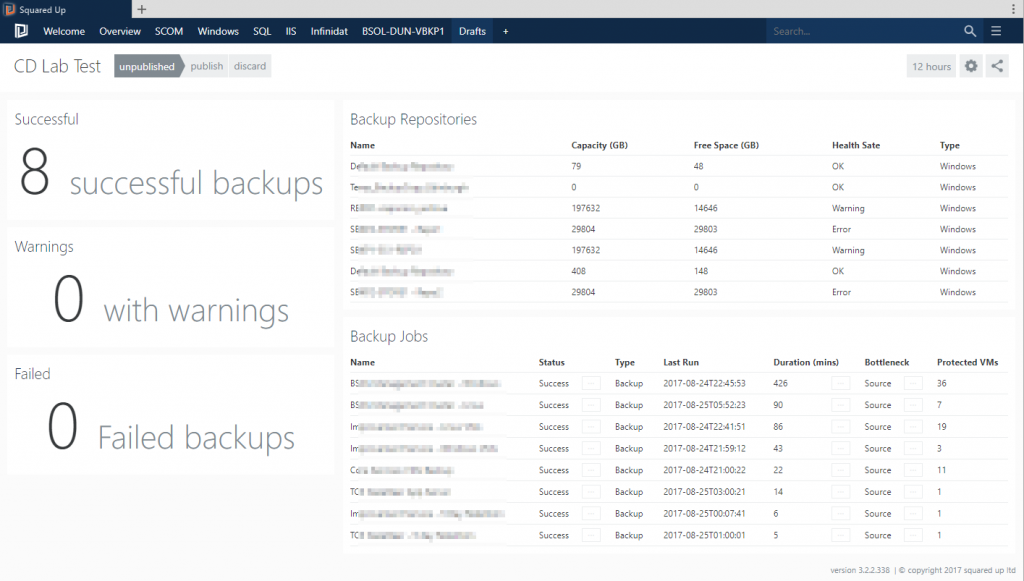
Conclusion
It’s still early days of the Web API tile but a promising start. There’s a couple of features/functions I’d like to see introduced (dynamic column widths, conditional formatting on the values) and knowing how receptive the team at SquaredUp are I’m sure the suggestions will have been taken on board.
There you go folks, if me the API n00b can get a dashboard up and running in relatively no time, then I’m sure you won’t have too much difficulty either.
Looking forward to seeing what you can come up with.


